Understanding the fluctuations in employment levels across different sectors over a period can be a challenging topic, but it’s a common theme in IELTS Writing Task 1. This article will delve into this topic and provide valuable insights, useful vocabulary, and practical tips to help you achieve a high score in this part of the IELTS exam.
Introduction
In IELTS Writing Task 1, you may be asked to describe data, trends, and changes over a specific period. One frequent topic is the comparison of employment levels across various sectors over a span of multiple years. The ability to accurately analyze and describe such data is crucial for achieving a high score.
Examples of task prompts might include:
- “Compare the levels of employment in different sectors from 2000 to 2023.”
- “Analyze the changes in employment across various industries between 2000 and 2023.”
- “Describe the trends in employment levels in different sectors over the period from 2000 to 2023.”
Task Prompt and Data Presentation
Let’s consider the following task:
Task:
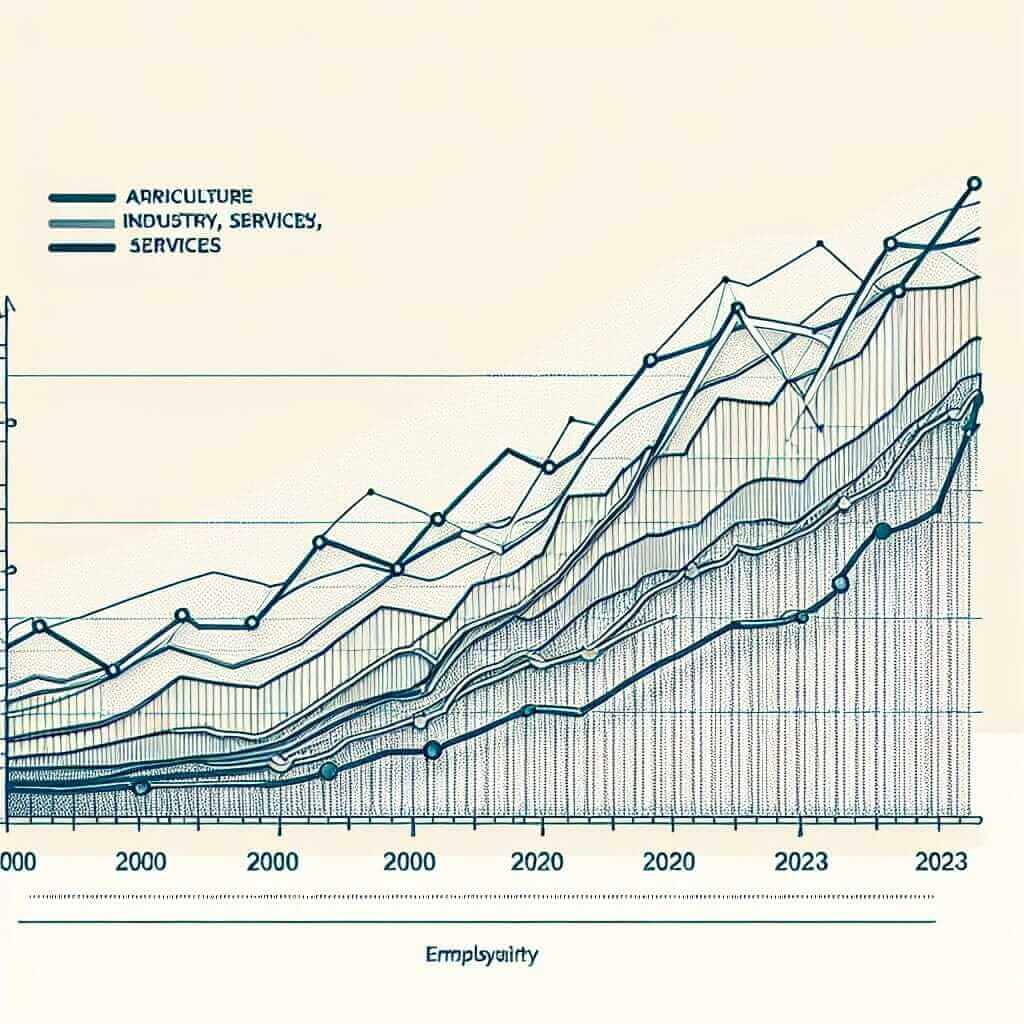
The graph below shows the levels of employment in different sectors of the economy (Agriculture, Industry, and Services) from 2000 to 2023.
Summarize the information by selecting and reporting the main features, and make comparisons where relevant.
(For the purposes of this example, we’ll assume the data below):
| Year | Agriculture (%) | Industry (%) | Services (%) |
|---|---|---|---|
| 2000 | 32 | 25 | 43 |
| 2005 | 28 | 27 | 45 |
| 2010 | 22 | 30 | 48 |
| 2015 | 18 | 32 | 50 |
| 2020 | 15 | 33 | 52 |
| 2023 | 12 | 35 | 53 |
 Employment Levels by Sector
Analyzing the Task
First and foremost, analyze the task to understand what you need to include in your response. You are required to:
- Summarize the information.
- Highlight the main features.
- Make comparisons where relevant.
Essentially, your response should include:
- A clear introduction.
- An overview of the main trends.
- Detailed comparisons and descriptions of the data.
Sample Answer
Let’s draft a comprehensive response:
Introduction:
The graph illustrates the employment levels in three different sectors (Agriculture, Industry, and Services) from 2000 to 2023.
Overview:
Overall, employment in the Agriculture sector has seen a consistent decline, whereas the Industry and Services sectors experienced a steady increase over the period.
Details and Comparisons:
In 2000, Agriculture was a significant employer with 32% of the workforce, but this figure dropped drastically to 12% by 2023. Conversely, the Industry sector employed 25% of the workforce in 2000, and this rose steadily to 35% in 2023. The Services sector showed the most substantial growth, starting at 43% in 2000 and reaching 53% by 2023, making it the largest employment sector by a large margin.
From 2000 to 2005, Agriculture fell from 32% to 28%, while Industry increased by 2% and Services by 2%. This trend continued, with Agriculture decreasing to 22% in 2010 and Services rising to 48%. Interestingly, the years 2010 to 2015 saw a sharper decline in Agriculture to 18%, while Industry and Services rose to 32% and 50%, respectively. The period from 2020 to 2023 highlights a slower rate of change but continued the trend with Agriculture dipping to its lowest at 12% and Services reaching its peak at 53%.
Word Count: 170
Tips for Writing
To write an effective IELTS Writing Task 1 response, keep in mind the following tips:
- Begin with an introduction that paraphrases the task prompt.
- Provide an overview that summarizes the main trends.
- Use a variety of sentence structures to describe the data.
- Include at least one complex sentence in your description.
- Use accurate vocabulary related to employment and changes.
- Be clear and precise with your descriptions of data.
- Make comparisons where relevant to highlight contrasts and trends.
- Conclude with a concise summary of the main findings.
Vocabulary to Remember
Here are some useful words and phrases to describe data in such tasks:
- Decline (n, v) /dɪˈklaɪn/: a gradual decrease.
- Increase (n, v) /ɪnˈkriːs/: become larger in number or amount.
- Steady (adj) /ˈstedi/: firmly fixed, constant, not subject to change.
- Substantial (adj) /səbˈstæn(t)ʃəl/: of considerable importance, size, or worth.
- Drastic (adj) /ˈdræstɪk/: likely to have a strong or far-reaching effect.
- Consistent (adj) /kənˈsɪstənt/: unchanging in achievement or effect over a period.
- Contrasting (adj) /ˈkɒn.træstɪŋ/: very different.
- Notable (adj) /ˈnoʊtəbl/: worthy of attention or notice.
- Fluctuation (n) /ˈflʌktuˌeɪt/: an irregular rising and falling in number or amount.
Conclusion
To master IELTS Writing Task 1, practice is key. Focus on summarizing information accurately, highlighting main trends, making comparisons, and using varied and precise vocabulary. By understanding the typical patterns in employment levels across different sectors, you can approach such tasks with confidence and clarity, aiming for a Band 7 or higher.
Remember, effective practice and attention to detail will pave the way for success in your IELTS Writing Task 1. Good luck!


