Understanding and analyzing different levels of energy consumption across countries is a significant aspect of global economic studies. This topic not only reflects the industrial growth of a nation but also highlights the energy management and the economic policies in place. In the context of the IELTS Exam, this subject is common in Writing Task 1, where candidates are expected to report, summarize, or compare data presented in various formats.
Introduction
The subject of “Comparing Levels of Energy Consumption in Different Countries (2000-2023)” is a frequent topic in IELTS Writing Task 1. Candidates could be given data in the form of line graphs, bar charts, or tables and asked to compare the energy consumption between different years and countries.
Example Tasks:
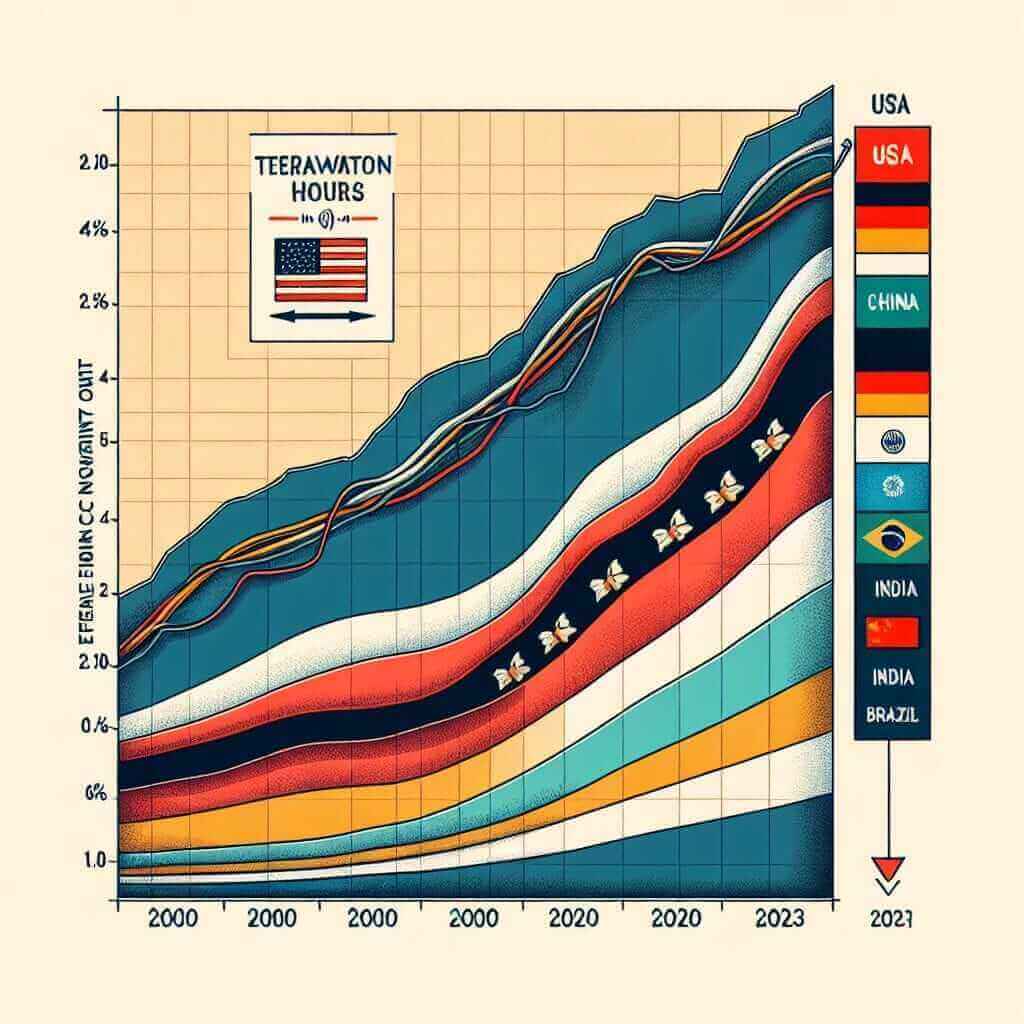
- The graph below shows the annual energy consumption (in Terawatt hours) in five different countries from 2000 to 2023. Summarize the information by selecting and reporting the main features, and make comparisons where relevant.
- The table below compares the average energy consumption per person in various countries from the year 2000 and 2023. Summarize the information by reporting the key features and making comparisons.
Main Content
Sample Task
For this article, let’s choose the following sample task for detailed analysis:
Task: The graph below shows the annual energy consumption (in Terawatt hours) in five different countries from 2000 to 2023. Summarize the information by selecting and reporting the main features, and make comparisons where relevant.
Analyzing the Task
When approaching this task, several steps can simplify and streamline the process:
- Understand the Overall Trend: First, examine the graph for general trends. Are there increases, decreases, or fluctuations?
- Identify Key Features: Focus on the highest and lowest points, noticeable changes, and comparisons between countries.
- Plan Your Structure: Typically, a report structure includes an introduction, an overview of the main trends, and detailed comparisons.
Writing Sample
Let’s assume the given data compares the energy consumption in the USA, China, Germany, India, and Brazil from 2000 to 2023. Using a hypothetical line graph, we can write a sample response.

Sample Response:
The line graph illustrates the annual energy consumption in Terawatt hours in five countries— the USA, China, Germany, India, and Brazil— from 2000 to 2023. Overall, China and India experienced significant growth in energy consumption, while the USA showed a steady decline. Germany and Brazil had relatively stable consumption patterns with minor fluctuations.
In 2000, the USA had the highest energy consumption at 19,000 TWh, while China followed at 12,000 TWh. By 2023, China surpassed the USA, with consumption soaring to 24,000 TWh, while the USA dropped to 16,000 TWh. India’s consumption surged from 6,000 TWh in 2000 to 18,000 TWh in 2023, indicating rapid industrial development.
On the other hand, Germany’s consumption fluctuated slightly around 8,000 TWh, experiencing a slight peak at 9,000 TWh in 2010 before returning to its initial level by 2023. Similarly, Brazil maintained a relatively modest increase from 4,000 TWh to 6,000 TWh during the same period.
In conclusion, while China and India demonstrated substantial increases in energy consumption, the USA observed a decline. Germany and Brazil exhibited minor fluctuations, maintaining relative stability.
Word count: 187
Key Vocabulary and Grammar Tips
Important Vocabulary
- Consumption (n) [kənˈsʌmp.ʃən]: The amount of something that is used.
- Fluctuation (n) [ˌflʌk.tʃuˈeɪ.ʃən]: Irregular variation.
- Surge (v) [sɝːdʒ]: To increase suddenly and powerfully.
- Stability (n) [stəˈbɪl.ə.ti]: The state of being steady and not changing.
- Substantial (adj) [səbˈstæn.ʃəl]: Of considerable importance or size.
Grammar Tips
- Comparative and Superlative Forms:
- Comparative: “China’s consumption increased more rapidly than India’s.”
- Superlative: “The USA had the highest energy consumption in 2000.”
- Tense Consistency:
- Past Simple for completed actions: “In 2000, the USA had the highest consumption.”
- Present Perfect for ongoing states: “China has surpassed the USA in energy consumption.”
- Linking Words:
- Use conjunctions (and, but, or) to link ideas.
- Use sequencers (first, next, finally) to order information logically.
- Use phrases of comparison (similarly, in contrast) to draw relationships between data points.
Conclusion
To achieve a Band 7+ score in IELTS Writing Task 1, it is crucial to accurately describe and compare data while employing a diverse range of vocabulary and correct grammatical structures. Remember to always cover the key trends, compare relevant figures, use appropriate language, and ensure that your report is coherent and logically structured.
Through practice and analysis, mastering these elements will allow candidates to effectively tackle any data comparison task in the IELTS Writing Exam.