The topic of comparing levels of internet connectivity in different regions over time is significant in the IELTS Writing Task 1. Graphs, charts, or tables on this theme frequently appear in actual IELTS exams, making it paramount for IELTS candidates to master the analytical and descriptive aspects of the task.
Below, we will explore this topic comprehensively, leveraging data, creating task prompts, and providing writing samples to help you achieve Band 7+ in your exam.
Sample Prompts
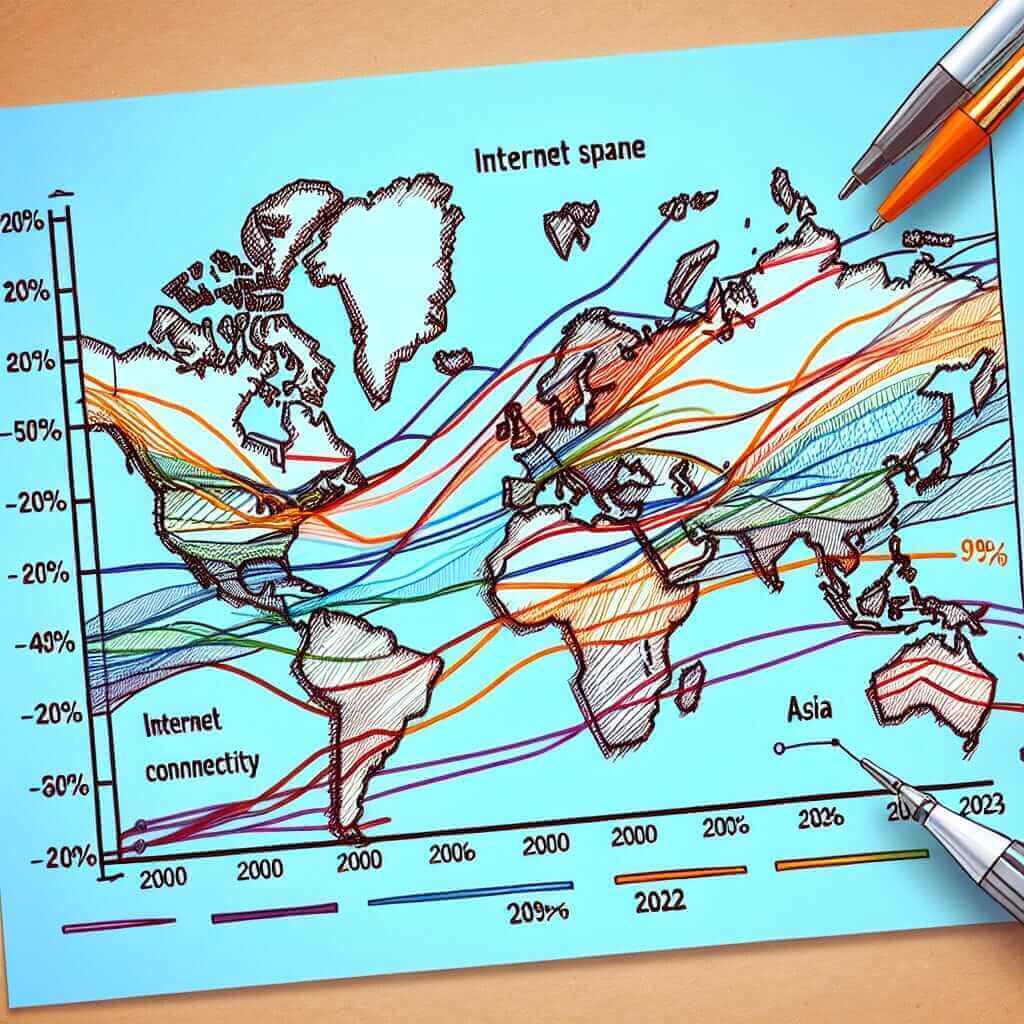
- The graph below shows internet connectivity levels in different regions across the years 2000 to 2023. Summarize the information by selecting and reporting the main features, and make comparisons where relevant.
- The table provides information on the percentage of internet users in various regions from 2000 to 2023. Summarize the main features and make comparisons.
- The charts illustrate the growth of internet connectivity in several regions between 2000 and 2023. Summarize the key trends and make comparisons.
Choosing a Prompt
Let’s choose the following prompt for practicing:
“The graph below shows internet connectivity levels in different regions across the years 2000 to 2023. Summarize the information by selecting and reporting the main features, and make comparisons where relevant.”
Gathering Data and Creating a Graph
For this exercise, let’s assume you have a graph showing five regions: North America, Europe, Asia, Africa, and South America. Here’s a sample dataset:
| Year | North America | Europe | Asia | Africa | South America |
|---|---|---|---|---|---|
| 2000 | 45% | 30% | 15% | 5% | 10% |
| 2010 | 70% | 60% | 40% | 20% | 35% |
| 2020 | 85% | 80% | 60% | 40% | 60% |
| 2023 | 90% | 87% | 75% | 55% | 75% |

Analyzing the Prompt
When analyzing this task, consider the following points:
- Identify key trends: Describe the overall changes over the years.
- Compare the regions: Highlight significant differences or similarities between the regions.
- Point out any anomalies or unique trends.
Sample Writing
Based on our dataset, here is a sample writing response:
The graph illustrates the levels of internet connectivity in North America, Europe, Asia, Africa, and South America from 2000 to 2023. Overall, all regions show a significant increase in internet connectivity over the given period, with North America and Europe leading throughout the years.
In 2000, North America had the highest internet connectivity at 45%, followed by Europe at 30%. Asia and South America had lower connectivity rates at 15% and 10%, respectively, while Africa had the lowest at 5%. By 2010, internet connectivity significantly improved across all regions, with North America reaching 70% and Europe 60%. Asia, Africa, and South America also saw increases to 40%, 20%, and 35%, respectively.
By 2020, North America and Europe had connectivity levels of 85% and 80%, indicating that the gap between them had narrowed. Meanwhile, Asia saw a substantial rise to 60%, matching South America, which also reached 60%. Africa, although improving, still lagged with 40% connectivity.
In 2023, North America maintained its leading position at 90%, closely followed by Europe at 87%. Asia and South America experienced significant growth, both reaching 75%. Africa continued its upward trend but remained the region with the lowest connectivity at 55%.
In summary, while all regions have shown remarkable growth in internet connectivity from 2000 to 2023, North America and Europe remained the front-runners. The most notable improvements were seen in Asia and South America, highlighting a closing gap among global regions. Despite this, Africa, although improving, continues to lag in internet connectivity compared to other regions.
Word count: 243
Key Vocabulary and Grammar
Vocabulary
- Connectivity (n) – /kəˌnɛktɪˈvɪti/
- Significant (adj) – /sɪɡˈnɪfɪkənt/
- Improvement (n) – /ɪmˈpruːvmənt/
- Region (n) – /ˈriːdʒən/
- Trend (n) – /trɛnd/
Grammar
- Comparative and Superlative Adjectives: Examples include “higher,” “lowest,” “leading position”. These help compare data across different regions.
- Tenses: Use present perfect to describe general trends over time (e.g., “have shown remarkable growth”).
- Complex Sentences: To articulate comparisons and trends effectively (e.g., “Despite this, Africa, although improving, continues to lag in internet connectivity compared to other regions.”).
Conclusion
When approaching IELTS Writing Task 1, especially for topics involving data comparison over time, it’s essential to:
- Identify and describe key trends.
- Make relevant comparisons.
- Use appropriate vocabulary and complex sentences to demonstrate advanced language proficiency.
By mastering these strategies, candidates can aim for a Band 7+ score in their IELTS Writing exam.