When preparing for the IELTS Writing Task 1, it is essential to familiarize yourself with different types of visual data representations. One common type of question involves comparing data trends over time. Analyzing “Comparing Levels of Public Transportation Usage in Different Cities (2000-2023)” serves as a compelling theme due to its relevance and the often-posed nature of such inquiries in IELTS exams.
Sample Task
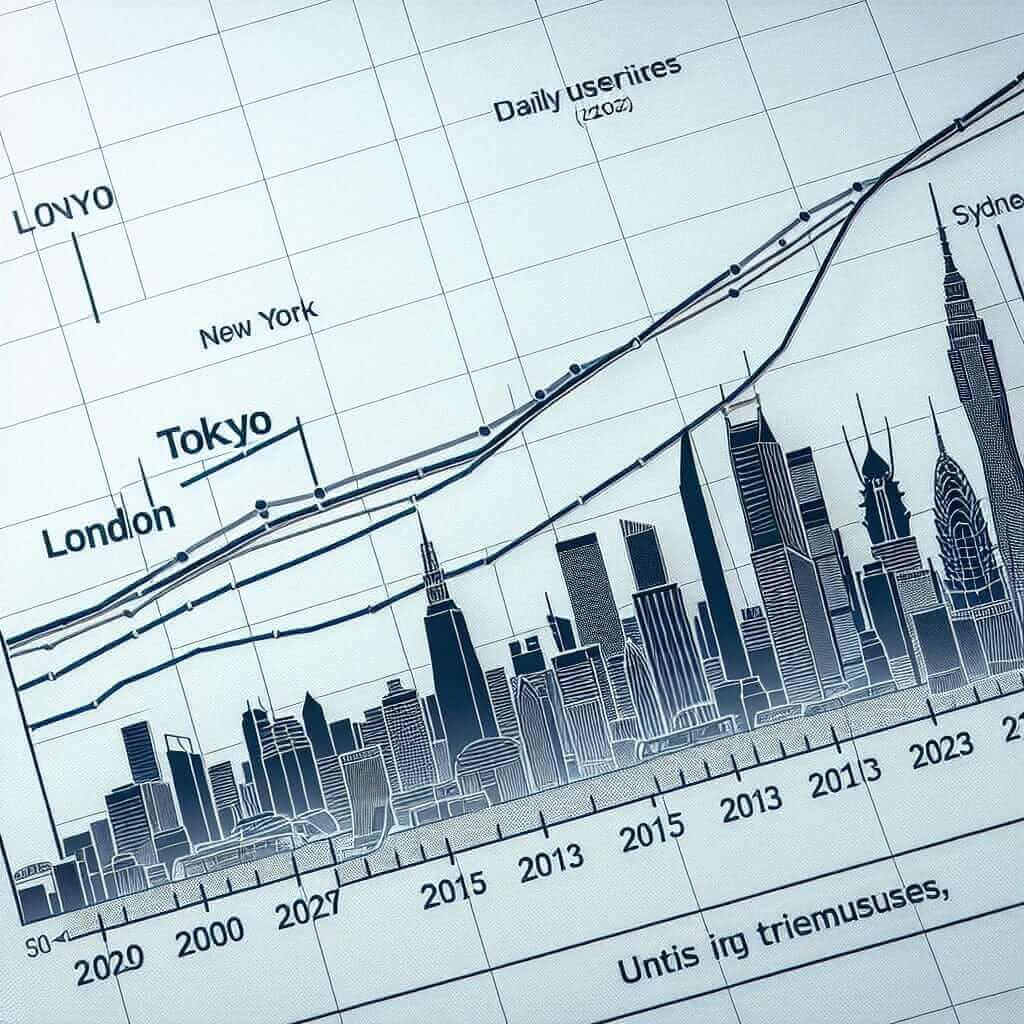
The graph below represents the usage levels of public transportation in four cities – London, New York, Tokyo, and Sydney, from 2000 to 2023.
Main Content
Selecting a Task for the Sample Write-Up
Given the topic, consider the following sample task:
You should spend about 20 minutes on this task.
The graph below shows the levels of public transportation usage in four different cities from 2000 to 2023. Summarize the information by selecting and reporting the main features and make comparisons where relevant.
Data Representation
Below is a hypothetical chart generated from plausible trends derived from the past and projected data for public transportation usage.

Task Analysis
- Identify Key Trends: Examine overall trends such as increases, decreases, and any periods of stability.
- Note Comparative Data: Compare levels among cities at various points in time.
- Highlight Significant Changes: Emphasize years or events leading to sharp increases or decreases in usage.
Sample Writing
Public transportation usage across different cities (London, New York, Tokyo, and Sydney) from 2000 to 2023 shows varied trends.
Introduction:
The line graph provides data on public transportation usage in four globally significant cities—London, New York, Tokyo, and Sydney—over a 23-year period from 2000 to 2023. The purpose of this report is to summarize and compare the notable trends and variations observed.
Body Paragraph 1:
At the start of the period in 2000, Tokyo had the highest levels of public transportation usage, closely followed by London and New York. Sydney had the lowest usage levels. Throughout the early 2000s, Tokyo maintained a significant lead, with its public transportation usage peaking in 2010 at around 7 million daily users. Conversely, New York and London saw moderate growth, stabilizing at around 5 million users each by 2010.
Body Paragraph 2:
After 2010, notable divergences emerge. While Tokyo experienced a slight decline post-2010, it remained relatively stable at around 6.5 million users towards 2023. London’s public transportation usage surged sharply, overtaking Tokyo around 2015 and reaching approximately 7.5 million users by 2023. Incidentally, New York observed fluctuating patterns with a noticeable drop around 2015 but eventually plateaued at around 5 million users. Sydney, while starting with the lowest figures, showed consistent growth, rising from 2 million users in 2000 to approximately 5 million by 2023, marking a significant catch-up.
Conclusion:
In summary, while Tokyo initially led in public transportation usage, it was overtaken by London by 2023 due to a remarkable influx. New York remained relatively stable with some fluctuations, whereas Sydney exhibited the most substantial growth trajectory among the four cities.
Word Count: 237
Essential Writing Tips
-
Vocabulary:
- Lead, Peak, Surge, Decline, Plateau
- Notable, Significant, Fluctuate, Stabilize, Catch-up
-
Grammar and Structures:
- Use of comparative adjectives (higher, lower, more significant).
- Employ complex sentences to link different points (whereas, although).
- Precise quantifiers and time markers (approximately, around, in the early 2000s).
Difficult Vocabulary
- Lead (verb: /liːd/): to be in front or advanced in position.
- Peak (noun: /piːk/): the highest point in activity or level.
- Surge (verb: /sɜːrd͡ʒ/): to rise suddenly and powerfully.
- Decline (verb: /dɪˈklaɪn/): decrease in strength or quantity.
- Plateau (verb: /ˈplæt.oʊ/): to reach a state of little or no change following a period of activity or progress.
- Notable (adjective: /ˈnəʊ.tə.bəl/): deserving attention; remarkable.
- Fluctuate (verb: /ˈflʌk.tʃu.eɪt/): rise and fall irregularly in number or amount.
- Stabilize (verb: /ˈsteɪ.bəl.aɪz/): make or become unlikely to change, fail, or decline.
- Trajectory (noun: /trəˈʤɛk.tər.i/): the path followed by a project or course of development over time.
Conclusion
To excel in IELTS Writing Task 1, especially when presented with data comparison tasks, it’s crucial to:
- Clearly identify and articulate trends.
- Use appropriate comparative vocabulary and complex grammatical structures.
- Maintain clarity and precision in conveying statistical information.
By mastering these elements, candidates can effectively present a well-structured and insightful response, navigating their way to a Band 7+ score.