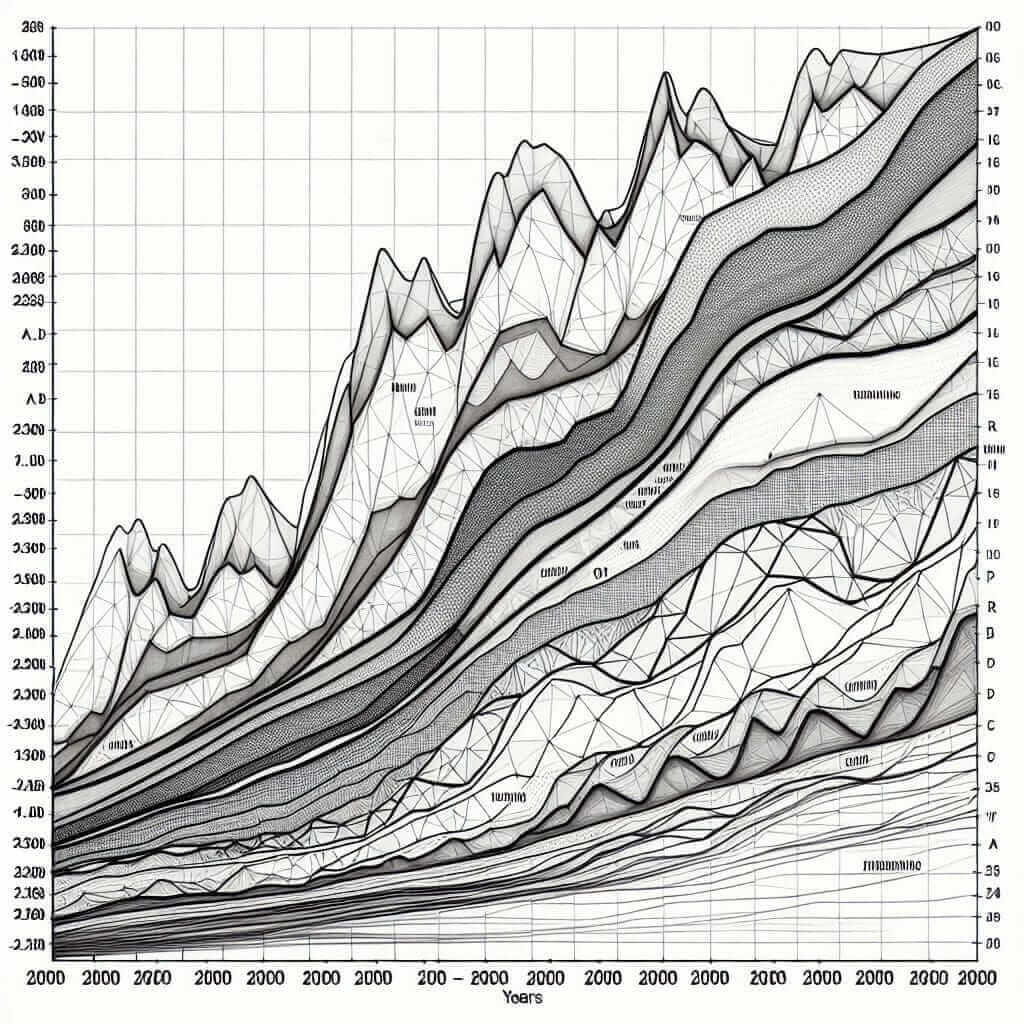
The topic “Comparing Levels of Renewable Energy Production in Different Countries (2000-2023)” has been a frequent subject in IELTS Writing task 1. It often involves interpreting data from tables, line graphs, or bar charts. This can be an excellent practice for your IELTS Writing task 1 as it tests your ability to describe and compare data, a crucial skill to score high marks.
In this article, we will delve into how to tackle such tasks effectively, including creating sample tasks, analyzing them, writing model answers, and providing essential vocabulary and grammar tips.
Let’s start by generating some sample tasks related to this topic.
Sample Task 1
The graph below shows the renewable energy production (in Terawatt hours) of four countries (A, B, C, D) from 2000 to 2023. Summarize the information by selecting and reporting the main features, and make comparisons where relevant.

Sample Task 2
The table below provides information about the percentage of renewable energy in total energy production in five countries from 2000 to 2023. Summarize the information by selecting and reporting the main features, and make comparisons where relevant.
Sample Task 3
The bar chart below illustrates the levels of wind and solar energy production in three different countries from 2000 to 2023. Summarize the information by selecting and reporting the main features, and make comparisons where relevant.
Task Analysis
Let’s choose Sample Task 1 for detailed analysis and writing a model answer.
Data Analysis
Imagine the given graph shows the renewable energy production in Terawatt hours (TWh) of four countries A, B, C, and D from 2000 to 2023. We need to analyze the data trends over the period and compare the energy production levels among these countries.
Key Observations
- Country A shows a steady increase in renewable energy production.
- Country B has a significant jump around 2010.
- Country C exhibits fluctuating production levels throughout the period.
- Country D starts low but sees a rapid increase post-2015.
Model Answer
The line graph illustrates the production of renewable energy measured in Terawatt hours (TWh) in four different countries (A, B, C, and D) from 2000 to 2023.
Overall, it is evident that there are distinct trends in renewable energy production among the four countries over the 23-year period. While Countries B and D experienced substantial growth, Countries A and C had more modest increases with notable fluctuations.
In 2000, Country A began with renewable energy production of around 50 TWh, and this number steadily rose to reach approximately 150 TWh by 2023. Country B, on the other hand, started at a much lower level, producing only about 20 TWh. However, there was a significant surge from 2010 onwards, peaking at around 150 TWh in 2020 before slightly leveling off.
Country C displayed a different pattern, beginning with 40 TWh in 2000. The production fluctuated throughout the period, peaking at 100 TWh in 2015 before dropping back to around 80 TWh by the end of 2023. Meanwhile, Country D had an initial production level similar to Country B, at about 20 TWh, but saw a rapid increase post-2015, reaching 130 TWh in 2023.
In summary, despite the initial differences, Countries B and D exhibited the most significant growth in renewable energy production, potentially reflecting increased investment and development in renewable energy technologies in these nations.
(Word count: 231)
Writing Tips
When writing about such graphs:
- Introduction: Paraphrase the task statement.
- Overview: Highlight the key trends and overall comparison.
- Body Paragraphs: Divide the details logically, using numerical data to support your observations.
Vocabulary and Grammar Tips
Vocabulary
- Fluctuate (verb): To rise and fall irregularly in number or amount.
- Surge (noun/verb): A sudden powerful forward or upward movement.
- Peak (verb): Reach a highest point, either of a specified value or at a specified time.
- Modest (adjective): Not large, elaborate, or expensive.
- Steadily (adverb): At a continuous, regular, and even pace.
- Significant (adjective): Large or important enough to be noticed or have an effect.
- Rapid (adjective): Happening in a short time or at a fast pace.
Grammar
-
Comparative and Superlative Forms:
- Use comparative forms (‘more significant’, ‘higher’) when comparing two elements.
- Use superlative forms (‘the highest’, ‘the most substantial’) when comparing more than two elements.
-
Complex Sentences:
- Use conjunctions like ‘while’, ‘whereas’, ‘although’ to create complex, coherent sentences.
Conclusion
When tackling IELTS Writing task 1, especially data comparison tasks such as “Comparing Levels of Renewable Energy Production in Different Countries (2000-2023)”, structured analysis, coherent writing, and relevant vocabulary are key. With practice, you can master the art of interpreting and describing data effectively, striving for that Band 7+ score.