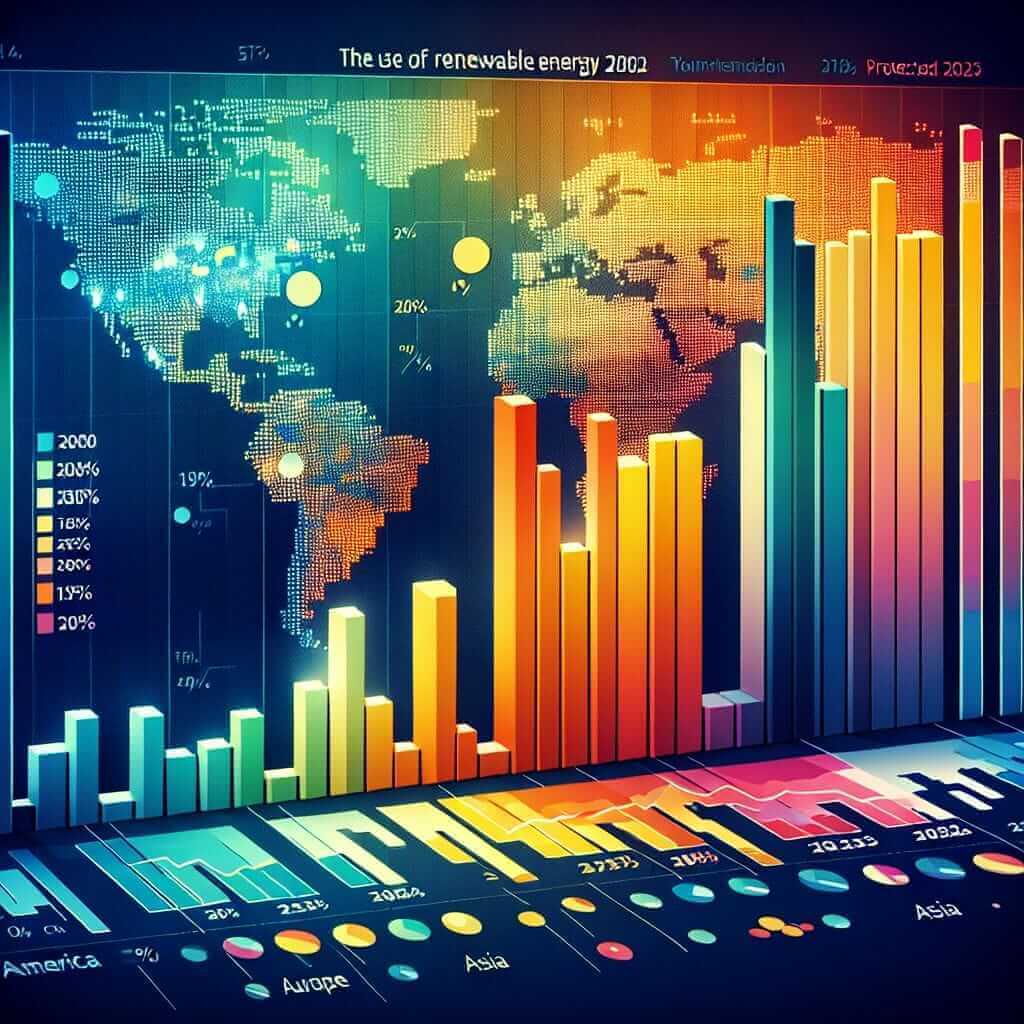
The topic of renewable energy usage is becoming increasingly prevalent, especially with worldwide efforts to combat climate change. For IELTS candidates, understanding this topic and being able to articulate and compare data accurately is essential, particularly for Writing Task 1. In this task, you are often required to describe and analyse data presented in charts, graphs, or tables. Renewable energy usage across different regions over a period from 2000 to 2023 serves as an excellent example for such tasks.
Example IELTS Writing Task 1 Prompts:
- The bar chart below shows the percentage of renewable energy used in various regions from 2000 to 2023. Summarize the information by selecting and reporting the main features and make comparisons where relevant.
- The line graph illustrates the growth of renewable energy consumption in four distinct regions between 2000 and 2023.
- The pie charts compare the percentage composition of renewable energy resources utilized in four different regions in the years 2000 and 2023.
Data Presentation and Analysis
To provide a comprehensive example, let’s consider a sample task: “The bar chart below shows the percentage of renewable energy used in various regions from 2000 to 2023.”
Here’s the data representation for our task:

| Year | North America | Europe | Asia | Africa |
|---|---|---|---|---|
| 2000 | 10% | 15% | 7% | 5% |
| 2005 | 15% | 20% | 10% | 7% |
| 2010 | 20% | 25% | 13% | 9% |
| 2015 | 25% | 35% | 18% | 12% |
| 2020 | 32% | 40% | 27% | 20% |
| 2023 | 40% | 45% | 35% | 25% |
Data Analysis:
- North America: Renewable energy usage increased consistently from 10% in 2000 to 40% in 2023.
- Europe: Started at a higher base of 15% in 2000, reaching 45% by 2023, reflecting a more aggressive adoption of renewable energy technologies.
- Asia: Similar growth trend but at a slightly slower pace, starting at 7% in 2000 and reaching 35% in 2023.
- Africa: Initially the lowest at 5% in 2000 but experienced steady growth to 25% by 2023.
Sample Essay:
The bar chart depicts the percentage of renewable energy used in various regions including North America, Europe, Asia, and Africa from 2000 to 2023. Overall, the data indicates a significant increase in renewable energy usage in all regions over the given period.
Notably, Europe started with the highest renewable energy consumption at 15% in 2000, which rose steadily to 45% by 2023. This demonstrates Europe’s leading position in renewable energy adoption. In contrast, North America began with a lower percentage of 10% in 2000. However, it showed a consistent and marked increase, reaching 40% by the end of the period.
Asia, starting at 7% in 2000, experienced a significant but slower rise compared to Europe and North America, culminating in a usage rate of 35% by 2023. Africa, which had the lowest initial percentage of 5% in 2000, saw a gradual increase to 25% in 2023. While this growth is noteworthy, it still remains the lowest among the regions analysed.
In summary, the chart highlights a remarkable and upward trend in renewable energy usage across all regions from 2000 to 2023, with Europe and North America showing the most significant increases. This reflects global efforts towards more sustainable energy sources.
Word Count: 199
Important Points and Vocabulary:
Vocabulary:
- Depict (v) /dɪˈpɪkt/: to show or represent by a drawing, painting, or other art form.
- Percentage (n) /pərˈsɛntɪdʒ/: a rate, number, or amount in each hundred.
- Region (n) /ˈriːdʒən/: an area or division, especially part of a country or the world having definable characteristics.
- Consumption (n) /kənˈsʌmpʃən/: the using up of a resource.
- Notably (adv) /ˈnoʊtəbli/: in a way that is worthy of attention.
- Gradual (adj) /ˈɡrædʒuəl/: taking place or progressing slowly or by degrees.
- Sustainable (adj) /səˈsteɪnəbl/: able to be maintained at a certain rate or level.
Key Grammar:
- Comparative Structures: e.g., “higher than,” “slower rise compared to,” “most significant increase.”
- Present Perfect: Used to talk about changes from the past to the current period, e.g., “has increased gradually.”
- Passive Voice: Helpful in making your writing more formal and impersonal, e.g., “the chart depicts,” “the data indicates.”
Key Tips:
- Identify key information: Focus on the most significant data points and trends.
- Use comparative structures: Highlight differences and similarities clearly.
- Keep it clear and concise: Ensure your analysis is easy to follow.
Conclusion
For IELTS Writing Task 1, accurately describing data trends and making relevant comparisons are crucial for achieving a high band score. By using appropriate vocabulary, grammatical structures, and staying focused on the main trends, you can craft a well-structured and coherent response. With consistent practice on topics like renewable energy usage across different regions, you can master the skills needed for IELTS success.