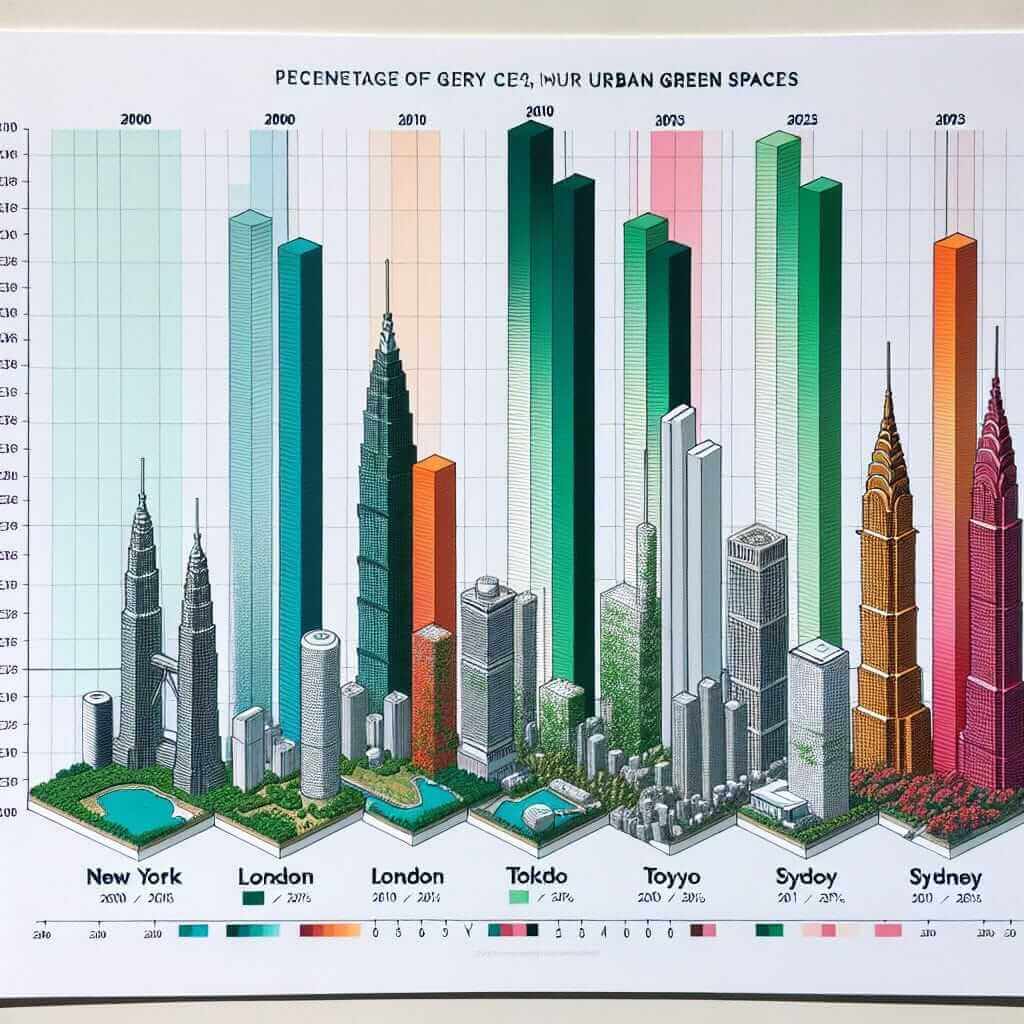
The availability of urban green space has become an important topic, reflecting on aspects of sustainability, livability, and public health in cities worldwide. In recent years, there’s been a noticeable trend to compare the levels of urban green space between different cities from 2000 to 2023. This type of comparison is a common topic in the IELTS Writing Task 1, where candidates are required to describe and compare visual information represented in graphs, charts, or tables.
In this article, we will explore this topic in detail, understanding how to approach it within the context of IELTS Writing Task 1. We will create a sample datable, analyze the task, and provide a model answer, along with useful vocabulary and grammatical structures to help score higher in the exam.
Sample Task and Data Visualization
Imagine you are given the task to compare urban green space in different cities from 2000 to 2023. Here is a possible example of such a task:
Sample Task
You should spend about 20 minutes on this task.
The table below shows the percentages of urban green space in four cities over three years (2000, 2010, and 2023).
Summarize the information by selecting and reporting the main features, and make comparisons where relevant.
Write at least 150 words.
| Year | New York | London | Tokyo | Sydney |
|---|---|---|---|---|
| 2000 | 14% | 33% | 12% | 46% |
| 2010 | 18% | 39% | 15% | 50% |
| 2023 | 22% | 42% | 18% | 52% |

Task Analysis
In this task, you are required to:
- Summarize the information from the table.
- Highlight the key trends and compare data among New York, London, Tokyo, and Sydney.
- Ensure your response is at least 150 words.
Model Answer
The table provides a comparison of the percentage of urban green space in New York, London, Tokyo, and Sydney over three distinct years: 2000, 2010, and 2023.
Overall, Sydney consistently has the highest percentage of urban green space, while Tokyo maintains the lowest throughout the years. All cities show an increase in urban green space from 2000 to 2023, with New York and Tokyo experiencing significant growth.
In 2000, Sydney had 46% of its urban area covered by green space, the highest among the four cities. London followed with 33%, whereas New York and Tokyo had lower percentages, 14% and 12% respectively. By 2010, all cities had increased their green spaces, with Sydney reaching 50%, London 39%, New York 18%, and Tokyo 15%.
By 2023, the trend continued with further increases. Sydney’s green space grew slightly to 52%, maintaining its lead. London accounted for 42%, followed by New York at 22% and Tokyo at 18%. Notably, New York showed the most substantial relative increase, rising from 14% to 22% over the 23-year period.
In conclusion, the data underline a uniform trend of increasing urban green space across all cities from 2000 to 2023, with Sydney consistently leading in the amount of green space available.
(210 words)
Vocabulary and Grammar Notes
Vocabulary to Remember
- Comparison (noun) /kəmˈpærɪsən/ – The act of examining the similarities and differences between two or more subjects.
- Percentage (noun) /pərˈsɛntɪdʒ/ – A proportion in terms of 100.
- Consistent (adjective) /kənˈsɪstənt/ – Always behaving in the same way or having the same standards.
- Trend (noun) /trɛnd/ – A general direction in which something is developing or changing.
- Significant (adjective) /sɪɡˈnɪfɪkənt/ – Sufficiently great or important to be worthy of attention; noteworthy.
- Increase (verb) /ɪnˈkriːs/ – To become or make greater in size, amount, or degree.
- Notably (adverb) /ˈnoʊtəbli/ – In a way that is remarkable or worthy of attention.
- Maintain (verb) /meɪnˈteɪn/ – To keep in an existing state.
Grammar Structures to Use
- Comparative and Superlative Forms:
- Example: “Sydney has the highest percentage of urban green space.”
- Past Simple and Present Perfect Tense:
- Example: “All cities have increased their green spaces since 2000.”
- Making Comparisons:
- Example: “Sydney’s green space grew slightly to 52%, maintaining its lead.”
- Describing Trends:
- Example: “The trend continued with further increases.”
Conclusion
Describing and comparing data on urban green space is a common task in IELTS Writing Task 1. By focusing on key trends and using appropriate vocabulary and grammar, you can create a coherent and well-structured response. Make sure to highlight the main features, use comparative forms, and include data-driven insights to achieve a high band score. With practice, you can effectively convey information and make meaningful comparisons within the context of the IELTS exam.