Water pollution is a recurrent theme in IELTS writing tasks, especially in Task 1 where candidates are required to describe visual information like graphs, tables, and pie charts. Understanding the levels of water pollution in different regions from 2000 to 2023 is an ideal topic that can appear in the IELTS test. This topic not only tests your ability to describe data accurately but also your capability to use comparative language and trends analysis.
Nội dung bài viết
In this article, we’ll delve into the specifics of this topic, exploring a sample task, analyzing it, and providing a model answer to help you achieve a high band score on the IELTS writing task 1.
Sample Task
Below is an example of a typical IELTS writing task 1 prompt on water pollution levels:
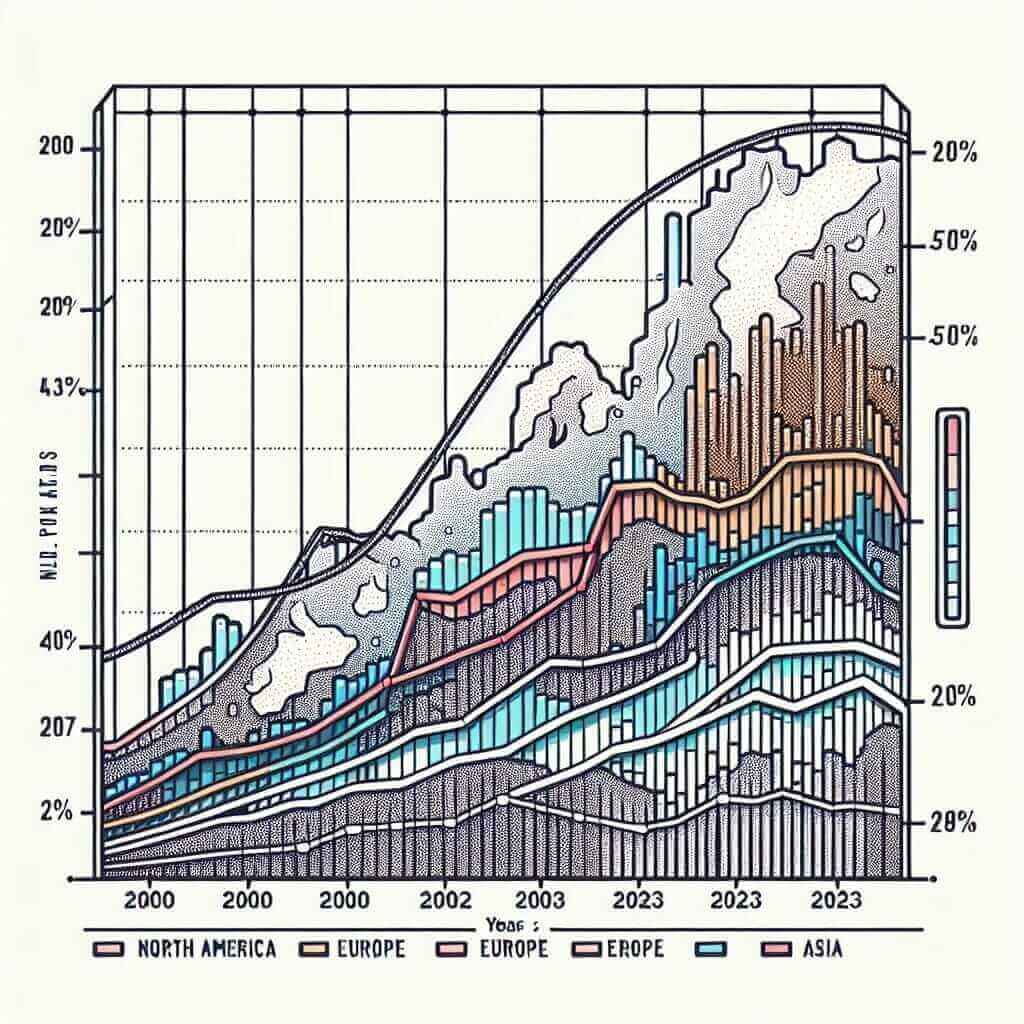
The table below shows the levels of water pollution in three different regions (North America, Europe, and Asia) from 2000 to 2023. Summarize the information by selecting and reporting the main features, and make comparisons where relevant.
| Year | North America | Europe | Asia |
|---|---|---|---|
| 2000 | 45% | 54% | 62% |
| 2005 | 42% | 51% | 59% |
| 2010 | 38% | 47% | 55% |
| 2015 | 35% | 44% | 52% |
| 2020 | 33% | 41% | 49% |
| 2023 | 34% | 40% | 47% |

Task Analysis
Understanding the Task
This table indicates the percentage of water pollution in North America, Europe, and Asia over a period of 23 years. When analyzing this table, you should:
- Identify general trends.
- Highlight significant changes.
- Make relevant comparisons between regions.
Key Phrases and Structures
-
Trends:
- “Overall, there has been a decrease in…”
- “All regions have shown a downward trend in…”
-
Comparisons:
- “While water pollution levels in Asia have remained the highest…”
- “In contrast, North America saw the lowest level of pollution…”
-
Significant Changes:
- “The most noticeable reduction occurred in Europe between 2000 and 2023…”
- “North America experienced a slight increase in the last three years…”
Model Answer
The table provides information on the percentage of water pollution in North America, Europe, and Asia from the year 2000 to 2023.
Overall, there has been a notable decrease in water pollution levels across all three regions over the period. Asia consistently experienced the highest levels of pollution, whereas North America had the lowest.
In the year 2000, water pollution levels in Asia were the highest at 62%, followed by Europe at 54%, and North America at 45%. By 2023, all these regions saw a decrease in pollution, with Asia reducing to 47%, Europe to 40%, and North America to 34%.
The most significant reduction was observed in Europe, where pollution decreased by 14 percentage points from 54% in 2000 to 40% in 2023. Similarly, North America experienced a steady decline from 45% to 34%, albeit with a slight rise between 2020 and 2023. Asia also saw a substantial decrease of 15 percentage points, from 62% to 47%.
In conclusion, despite the general downward trend in water pollution levels, Asia remained the region with the highest pollution throughout the years, while North America consistently had the lowest levels.
Word count: 180
Tips for Writing a High-Scoring Answer
-
Vocabulary and Grammar:
- Use a range of vocabulary related to the environment (e.g., “pollution,” “levels,” “reduction”).
- Utilize complex sentence structures for variety and sophistication.
- Ensure the correct usage of comparative language, e.g., higher, lower, more significant, less substantial.
-
Coherence and Cohesion:
- Structure your report logically, with clear paragraphs.
- Use appropriate linking words and phrases to connect your ideas, such as “However,” “In contrast,” “Similarly.”
-
Accuracy:
- Present data accurately as given in the chart or table.
- Avoid personal opinions; your task is to describe and compare the data objectively.
Key Vocabulary to Remember
- Decrease (verb) /ˈdiː.kriːs/: To become less.
- Percentage (noun) /pərˈsentɪdʒ/: A portion of 100.
- Pollution (noun) /pəˈluː.ʃən/: The contamination of the environment.
- Region (noun) /ˈriː.dʒən/: An area distinguished by specific characteristics.
- Consistently (adverb) /kənˈsɪs.tənt.li/: In every case or on every occasion.
Conclusion
Describing and comparing data on water pollution levels across different regions over time is a quintessential task in IELTS writing. To excel, remember to identify and describe trends, make relevant comparisons, and highlight significant changes. Using proper vocabulary and maintaining grammatical accuracy are also crucial. By following these guidelines, you are well-equipped to achieve a high band score on this part of the IELTS exam.