In the IELTS Writing Task 1, candidates are often required to analyze and report on data presented in various forms, such as graphs, tables, and charts. One common topic is comparing levels of water usage in different sectors over a period of years. Students must effectively interpret the data and convey the differences, trends, and key features in a clear and coherent manner.
Sample Task:
Below are two sample prompts related to the main topic:
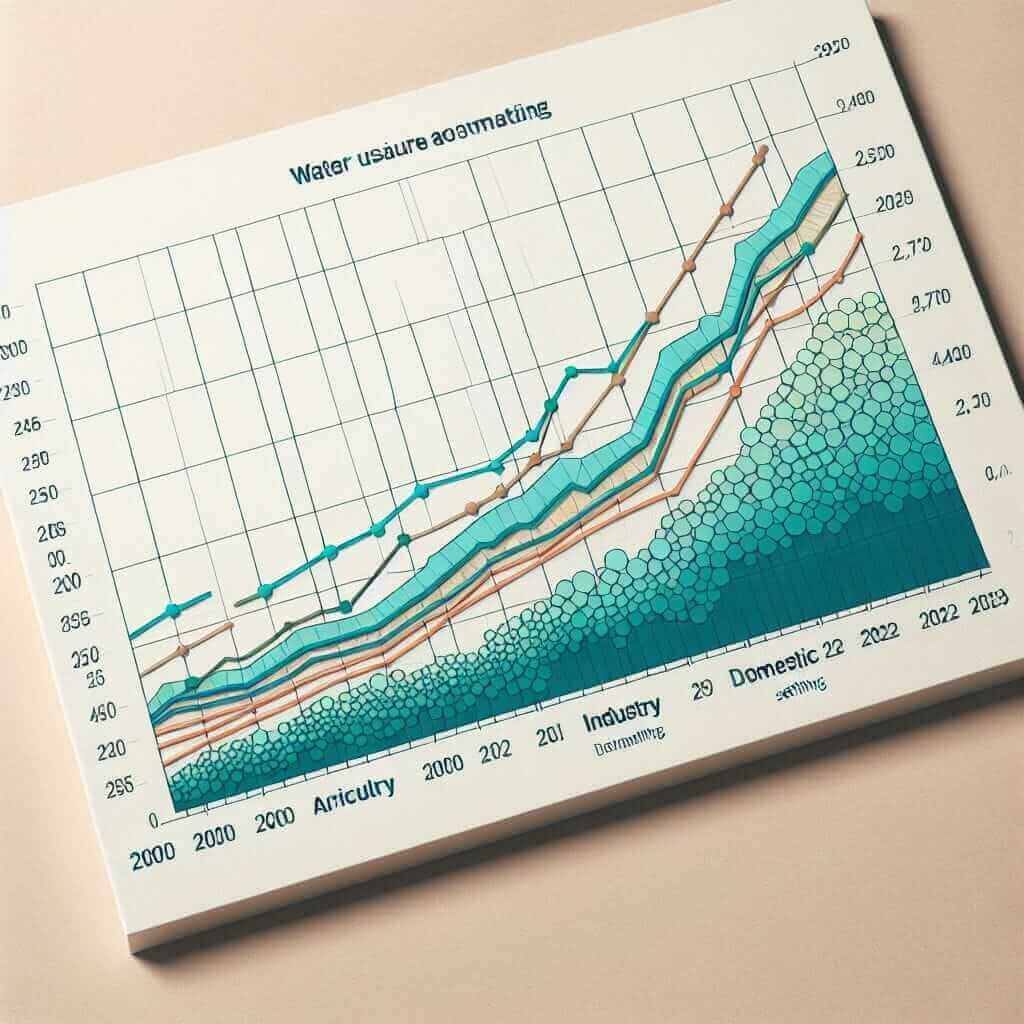
- The graph below shows water usage in different sectors (agriculture, industry, and domestic) from 2000 to 2023.
- The table below illustrates the percentage of water consumption in various sectors across different regions between 2000 and 2023.
For this article, we will focus on the first sample prompt concerning the comparison of water usage in different sectors from 2000 to 2023.
Detailed Analysis
Understanding the task and interpreting data accurately is crucial. Here’s a breakdown:
Sample Data:
Year | Agriculture (Million Cubic Meters) | Industry (Million Cubic Meters) | Domestic (Million Cubic Meters)
2000 | 700                                | 500                            | 300
2005 | 720                                | 550                            | 350
2010 | 750                                | 600                            | 400
2015 | 770                                | 650                            | 450
2020 | 800                                | 680                            | 500
2023 | 820                                | 700                            | 550
Writing Task 1 Sample:
Based on the above data, students are expected to produce a writing task that succinctly describes and compares the water usage among the three sectors over the given years.
Analysis:
- Introduction: Introduce the graph, mention the sectors and the time frame.
- Overview: Summarize the main patterns or trends without going into details.
- Details: Provide detailed comparisons, notice changes, and identify significant data points.
Example:
Introduction:
The graph illustrates the water usage in millions of cubic meters for agriculture, industry, and domestic sectors between the years 2000 and 2023.
Overview:
Overall, water consumption in all three sectors showed an upward trend. Agriculture consistently had the highest water usage, followed by industry and domestic sectors.
Detailed Paragraph:
From 2000 to 2023, water usage in agriculture rose steadily from 700 to 820 million cubic meters. The industry sector also saw a significant increase, albeit at a slower rate, from 500 to 700 million cubic meters. The domestic sector experienced the sharpest rise, nearly doubling from 300 to 550 million cubic meters over the same period.
Conclusion:
In conclusion, water use in all sectors increased, with agriculture always using the most and domestic use growing the fastest.
Writing Tips:
- Use Precise Language: Highlight specific figures and time frames.
- e.g., “rose steadily,” “saw a significant increase,” “the sharpest rise.”
- Time Connectors: Use appropriate linking words to show trends over time.
- e.g., “From 2000 to 2023,” “Over the same period,” “Between 2000 and 2005.”
- Descriptive Vocabulary:
- Upward Trends: “increased,” “rose,” “climbed,” “grew”
- Downward Trends: “decreased,” “fell,” “declined,” “dropped”
- Stability: “remained steady,” “stabilized”
- Grammar Focus:
- Use past simple for specific years: “In 2000, water usage was…”
- Use present perfect for overall trends: “Water consumption has increased steadily over the years…”
Key Vocabulary:
- Sector (n): /ˈsɛktər/ – A part or division, such as agriculture, industry, and domestic.
- Consumption (n): /kənˈsʌmpʃən/ – The using up of resources.
- Trend (n): /trɛnd/ – A general direction in which something is developing or changing.
- Significant (adj): /sɪɡˈnɪfɪkənt/ – Sufficiently great or important to be worthy of attention.
- Steady (adj): /ˈstɛdi/ – Firmly fixed, supported, or balanced; not shaking or moving.
Conclusion
When tasked with describing data on water usage, focus on identifying and comparing significant trends. Articulate your observations with appropriate vocabulary and coherent sentence structures, ensuring your writing is clear and precise. To aim for a Band 7+, practice integrating these elements seamlessly in your writing.
By following these guidelines and understanding the task requirements, you can approach the IELTS Writing Task 1 with confidence and achieve a high score.