The performance of students in public versus private schools has been a topic of ongoing debate and research. This subject frequently appears in the IELTS Writing Task 1, where candidates are often asked to compare and analyze data. In this article, we will create a detailed comparison, analyze relevant data, and provide an exemplary essay to help you excel in this specific task.
Common Occurrences in IELTS
“Comparing Student Performance in Public vs Private Schools” can appear in various forms such as bar graphs, line charts, and tables. Understanding how to tackle such comparisons is crucial for achieving a high band score.
Sample Tasks
- Line Graph: Comparing the average scores of students in public and private schools from 2000 to 2023.
- Bar Chart: Comparing the percentage of students achieving A grades in public and private schools over the years 2000, 2010, and 2023.
- Table: Showing the number of students graduating from public and private schools with honors from 2000 to 2023.
Chosen Task and Data Presentation
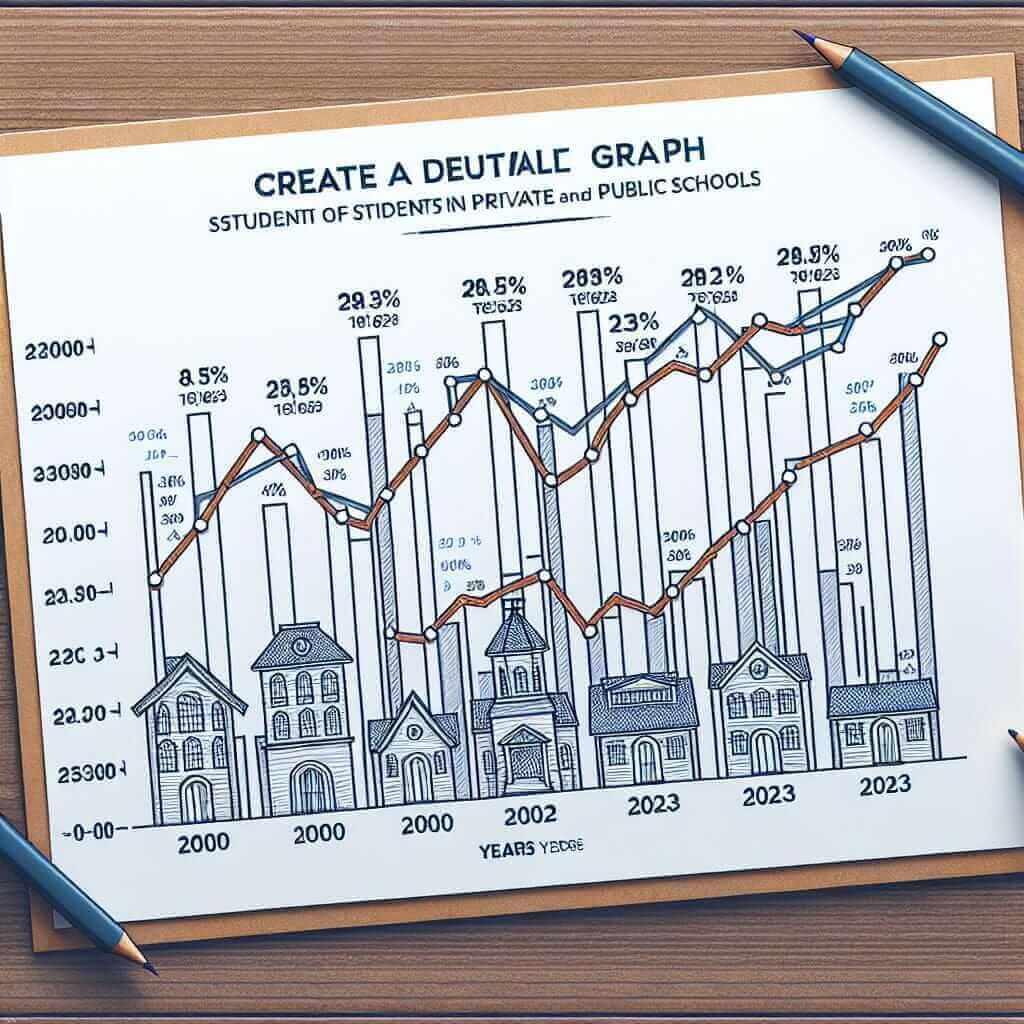
For this article, we’ll choose a line graph comparing the average test scores of students in public and private schools from 2000 to 2023.
Line Graph Data
Here is a fictional dataset that we will use:
| Year | Public School Average Score | Private School Average Score |
|---|---|---|
| 2000 | 68 | 75 |
| 2005 | 70 | 78 |
| 2010 | 72 | 80 |
| 2015 | 71 | 82 |
| 2020 | 73 | 85 |
| 2023 | 74 | 88 |

Analysis of the Task
The given line graph shows the average test scores of students in public and private schools over a period of 23 years. The trend lines indicate that private school students consistently outperform public school students.
Writing Sample
Below is a band 7+ sample essay based on the dataset provided.
The line graph provided compares the average test scores of students in public and private schools from the year 2000 to 2023.
Overall, it is evident that students from private schools consistently achieved higher average scores compared to their public school counterparts throughout the given period. Additionally, the gap in performance between the two groups widened over time.
In 2000, the average score of public school students was 68, whereas private school students had an average score of 75. This 7-point difference marked the beginning of a trend that saw private school students maintaining an advantage in performance. By 2005, the average scores increased slightly for both groups, with public school scores rising to 70 and private school scores to 78.
The trend of increasing scores continued for both sets of students, albeit at different rates. In 2010, the average scores reached 72 for public schools and 80 for private schools. During the next five years, public school scores saw a minor decrease to 71, contrasting with private school scores, which climbed to 82. This period marked the most significant gap in performance, reaching an 11-point difference.
In the final years of the dataset, both groups experienced an increase in average scores. By 2023, students in public schools were scoring an average of 74, while private school students attained an impressive average score of 88. The gap, at this point, stood at 14 points, illustrating a considerable divergence in student performance between the two types of schools.
In conclusion, the data clearly indicates that while both public and private school students improved their performance over the 23-year period, private school students consistently achieved higher average scores. The growing gap suggests that factors inherent to private schooling could be contributing to higher student performance.
(Word Count: 276)
Key Considerations When Writing
Vocabulary and Grammar Tips
- Consistently (adv.) /kənˈsɪstəntli/: Always happening in the same way (e.g., “Private school students consistently achieved higher scores.”)
- Performance (n.) /pərˈfɔrməns/: The action or process of performing a task or function (e.g., “The performance of students improved over the years.”)
- Widening (adj.) /ˈwaɪdənɪŋ/: Making something broader or more extensive (e.g., “The gap in performance between the two groups widened.”)
- Outperform (v.) /ˌaʊtpərˈfɔrm/: Perform better than others (e.g., “Private school students consistently outperform public school students.”)
- Illustrate (v.) /ˈɪləˌstreɪt/: Explain or make something clear by using examples (e.g., “The data clearly illustrates the performance differences.”)
Grammar Structures
- Comparatives and Superlatives: Use comparatives (higher, better) and superlatives (highest, best) to make comparisons clear.
- Present Perfect Tense: Useful for describing changes over time (e.g., “Students have improved their performance over the years.”)
- Passive Voice: Helps to focus on the action (e.g., “A significant gap was observed between the two types of schools.”)
Conclusion
To excel in IELTS Writing Task 1, particularly for comparisons such as public vs private school performance, it is essential to:
- Clearly identify trends and make relevant comparisons.
- Utilize a range of vocabulary and grammatical structures accurately.
- Organize your essay logically with an introduction, overview, main trends, and a conclusion.
By focusing on these key aspects, you can aim for a Band 7+ score effectively.