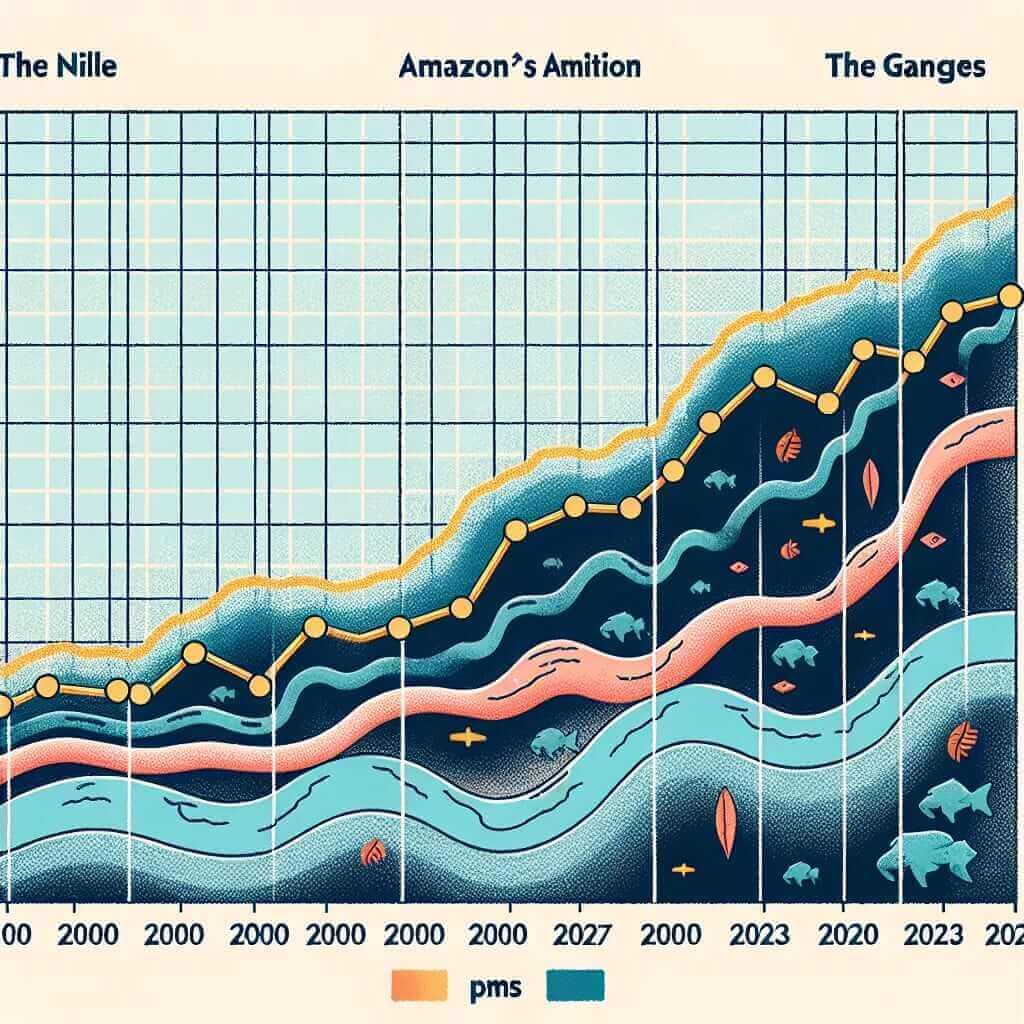
When preparing for the IELTS Writing Task 1, one common type of question involves describing and comparing data presented in graphs, charts, or tables. One such topic that has appeared in various forms is “Comparing Water Pollution Levels in Different Rivers (2000-2023).” In this guide, we’ll delve into the nuances of this topic, providing practical tips for writing a high-scoring response, along with examples and key vocabulary.
Potential Task Prompts
- “The chart below shows the levels of water pollution in three different rivers between 2000 and 2023. Summarize the information by selecting and reporting the main features, and make comparisons where relevant.”
- “The table below compares the water pollution levels in the Nile, Amazon, and Ganges Rivers over a period from 2000 to 2023. Summarize the information by selecting and reporting the main features, and make comparisons where relevant.”
- “The graph below illustrates the changes in water pollution levels of several major rivers from 2000 to 2023. Summarize the information by selecting and reporting the main features, and make comparisons where relevant.”
Detailed Guide to Writing Task 1 on This Topic
Example Task
Let’s take the first prompt as our example: “The chart below shows the levels of water pollution in three different rivers between 2000 and 2023. Summarize the information by selecting and reporting the main features, and make comparisons where relevant.”
Step-by-Step Analysis:
1. Understand the Data
The first step involves carefully examining the chart to understand the various elements. Let’s assume the chart shows pollution levels measured in parts per million (ppm) for the Nile, Amazon, and Ganges Rivers.
2. Identify Key Features:
- Time Frame: 2000 to 2023
- Variables: Water pollution levels in three rivers (Nile, Amazon, Ganges)
- Trends to Notice: Increasing, decreasing, fluctuations, or stability
Writing the Report:
1. Introduction
Start by paraphrasing the task prompt to introduce the data you will be describing.
Example: “The chart illustrates the water pollution levels (measured in parts per million) in the Nile, Amazon, and Ganges Rivers from 2000 to 2023.”
2. Overview
Provide an overview that identifies general trends without going into too much detail.
Example: “Overall, the pollution levels in all three rivers have shown significant variations over the given period, with the Nile experiencing the highest pollution levels throughout most of these years.”
3. Detailed Comparisons
Describe the data in more detail, making clear comparisons between the rivers.
Example:
“In 2000, the pollution levels of the Nile were relatively high at 50 ppm, compared to 30 ppm in the Amazon and 20 ppm in the Ganges. Over the next decade, the Nile’s pollution levels rose sharply, reaching a peak of 80 ppm by 2010. In contrast, the Amazon experienced a slight increase to 35 ppm, while the Ganges remained relatively stable around 25 ppm. From 2010 to 2023, the Nile’s pollution levels fluctuated but remained above 70 ppm. Meanwhile, both the Amazon and Ganges showed a gradual increase, with their pollution levels reaching 50 ppm and 45 ppm, respectively, by 2023.”
4. Summary
Conclude with a brief summary highlighting the most important observations.
Example:
“To summarize, the Nile River consistently exhibited the highest pollution levels over the 23-year period, while both the Amazon and Ganges showed gradual increases, with the Amazon experiencing slightly higher levels than the Ganges towards the end of the observed timeframe.”

Important Considerations:
Vocabulary
- Pollution levels (n.): The amount of pollutants present in the water.
- ppm (parts per million) (abbr.): Unit of measurement for pollutant concentration.
- Fluctuate (v.): To rise and fall irregularly.
- Stable (adj.): Showing little or no change.
- Peak (v.): To reach the highest point.
Grammar
- Use a range of grammatical structures.
- Employ complex sentences to compare different pieces of data.
- Make sure verb tenses are consistent (usually past simple for historical data).
Key Vocabulary to Remember:
- Pollution levels (n.) [pəˈluːʃən ˈlɛvəlz]
- Parts per million/ppm (n.) [ˈpɑrts pər ˈmɪljən]
- Fluctuate (v.) [ˈflʌktʃuˌeɪt]
- Stable (adj.) [ˈsteɪbl]
- Peak (v.) [piːk]
- Gradual (adj.) [ˈɡrædʒʊəl]
- Sharp (adj.) [ʃɑːrp]
- Consistently (adv.) [kənˈsɪstəntli]
- Decline (v.) [dɪˈklaɪn]
Conclusion
Successfully tackling an IELTS Writing Task 1 question on comparing water pollution levels involves understanding the data, identifying key trends, and clearly communicating your findings. By mastering this framework and tailoring it to specific prompts, you’ll be well-prepared to achieve a high band score. Remember to use varied vocabulary and grammatical structures to make your responses more dynamic and engaging.