The topic of wealth distribution across different countries is a crucial and recurring theme in IELTS Writing Task 1, especially when dealing with data representation tasks like line graphs, bar charts, pie charts, and tables. This analysis helps candidates improve their descriptive and analytical skills while extending their range of vocabulary and grammatical structures.
In this article, we’ll address the key knowledge areas related to “Distribution of Wealth in Different Countries (2000-2023)” and create a sample task and response drawn from this theme.
Sample Task 1:
You should spend about 20 minutes on this task.
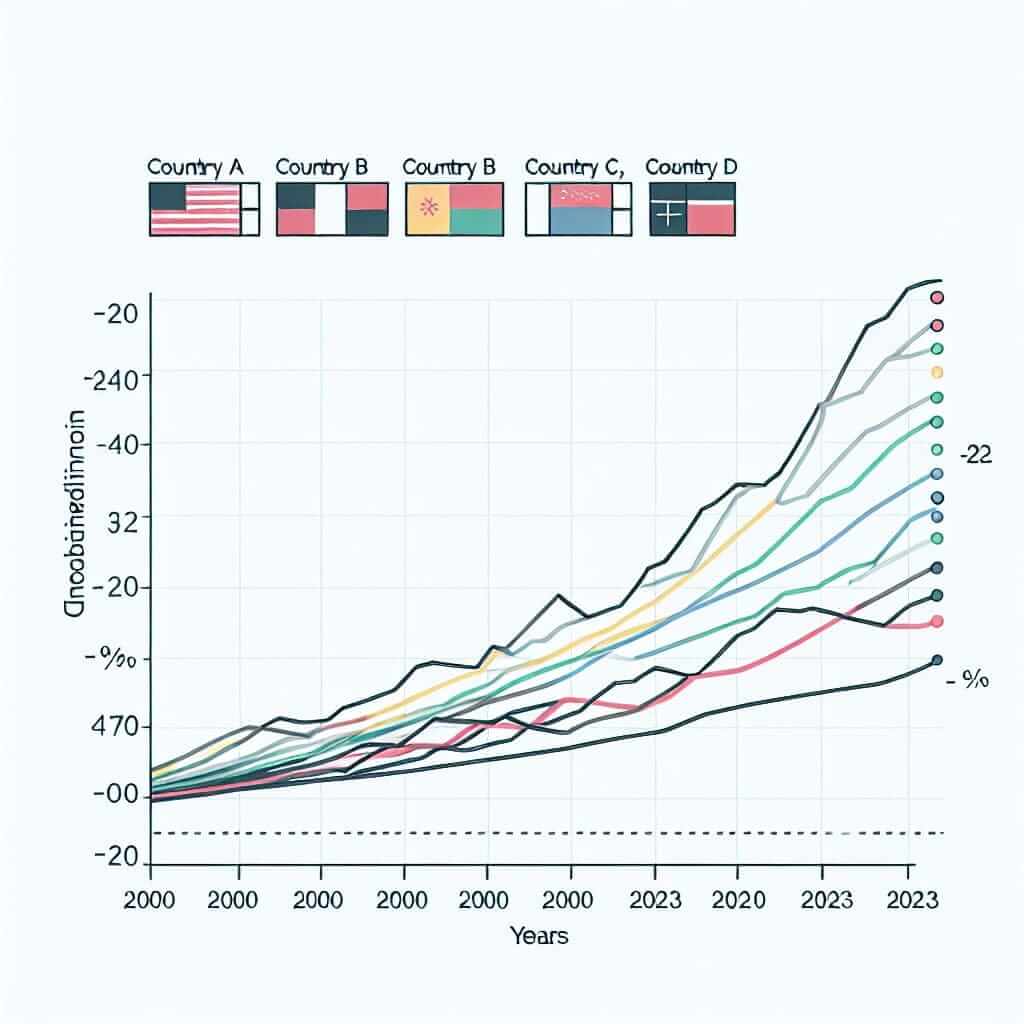
The graph below shows the distribution of wealth in four countries from 2000 to 2023.
Summarize the information by selecting and reporting the main features, and make comparisons where relevant.
Write at least 150 words.

Analyzing the Task
Understanding the task is the first step towards crafting a well-rounded response. Let’s break down the essential elements from the given task:
- Identify the Time Frame: The data covers the years 2000 to 2023.
- Countries Involved: The graph showcases four different countries.
- Types of Data: The measurement likely involves percentages or another metric indicating wealth distribution.
Writing the Response
Let’s move on to the actual writing task following a structured outline:
- Overview: A brief summary of what the graph shows overall.
- Highlight Key Trends: Note the most significant changes or patterns.
- Detailed Comparisons: Provide specific details and make comparisons where relevant.
Sample Writing Task 1 Response
Introduction
The line graph illustrates the distribution of wealth in four different countries—Country A, Country B, Country C, and Country D—over a span of 23 years, from 2000 to 2023.
Overview
Overall, the wealth distribution in these countries exhibited diverse trends, with some nations experiencing significant growth and others maintaining relatively stable or declining patterns.
Main Trends
Country A observed a steady increase in wealth distribution, climbing from around 15% in 2000 to just over 30% in 2023. In contrast, Country B showed a marked decline, dropping from 40% in 2000 to approximately 25% by 2023.
Country C showcased a unique pattern: an initial rise to about 35% in 2010, followed by a decrease to nearly 20% in 2023. Country D, on the other hand, remained relatively stable, fluctuating slightly around the 10% mark throughout the period.
In-Depth Comparisons
At the start of the period, Country A had the lowest distribution of wealth among the four countries. However, by 2023, it surpassed Country B and approached Country A, illustrating a major shift in economic dynamics. Meanwhile, Country B witnessed the most dramatic decline, highlighting potential economic challenges or policy changes.
Country C’s initial spike might indicate a particular economic boom or favorable conditions, which later led to a substantial decline. Lastly, Country D’s stability could suggest consistent economic policies or a lack of significant economic shifts.
(Word count: 218)
Important Considerations While Writing
Vocabulary and Grammar Tips
- Descriptive Adjectives: Use specific adjectives like “steady”, “significant”, “notable” to describe trends correctly.
- Comparative and Superlative Forms: Employ structures such as “more significant”, “the most dramatic”, “less substantial” for precise comparisons.
- Time Expressions: Phrases like “over the span of,” “throughout the period,” “by the year 2023” are useful to demonstrate the passage of time.
Advanced Vocabulary
- Fluctuate (verb) /ˈflʌk.tʃu.eɪt/: To rise and fall irregularly.
- Stability (noun) /stəˈbɪl.ə.ti/: A situation in which something is not likely to move or change.
- Diverse (adjective) /daɪˈvɜːs/: Showing a great deal of variety; very different.
- Distribution (noun) /ˌdɪs.trɪˈbjuː.ʃən/: The way in which something is shared out among a group or spread over an area.
- Decline (noun/verb) /dɪˈklaɪn/: A decrease in the quality, quantity, or importance of something.
- Spike (noun/verb) /spaɪk/: To rise quickly in amount or number.
- Consistent (adjective) /kənˈsɪs.tənt/: Unchanging in nature, standard, or effect over time.
- Economic boom (noun) /ˌiː.kəˈnɒm.ɪk buːm/: A period of significant output within a population.
- Implication (noun) /ˌɪm.plɪˈkeɪ.ʃən/: A likely consequence of something.
Conclusion
To score band 7+ in IELTS Writing Task 1, focus on clearly understanding the task requirements, providing a coherent overview, and detailing specific trends and comparisons. Utilize a rich variety of vocabulary and ensure grammatical accuracy to convey your analysis effectively.
By adopting this structured approach and integrating advanced language features, you can improve your ability to describe complex data accurately, which is essential for high performance in the IELTS exam.