As an IELTS instructor with over 20 years of experience, I often get asked about the structure of the IELTS Writing test, particularly Task 1. One common question is, “Does IELTS Writing Task 1 use stimulus material?” Let’s clarify this and explore the key elements of IELTS Writing Task 1.
Understanding IELTS Writing Task 1
The IELTS Writing test has two tasks, and they differ significantly in their format and requirements. Task 1 depends on whether you are taking the Academic or General Training module:
- Academic IELTS: You’ll be presented with a visual representation of data, such as a graph, chart, table, diagram, or a combination of these. Your task is to summarize the key information presented in this visual input in your own words.
- General Training IELTS: You’ll be asked to write a letter based on a given situation. You’ll be provided with prompts that outline the context, who you’re writing to, and the purpose of the letter.
Stimulus Material: Focusing on Academic IELTS
The term “stimulus material” directly applies to the Academic IELTS Writing Task 1. The visual input you see – be it a line graph depicting sales trends or a pie chart showing market share – is your stimulus material.

Here’s why understanding this is crucial:
- Task Focus: Your entire Task 1 response revolves around accurately and relevantly describing the information presented in this visual stimulus.
- No External Information: You are not expected to draw on any outside knowledge or personal experiences. Your analysis should stem solely from what you see in the provided visual.
Key Strategies for Academic IELTS Writing Task 1
- Analyze the Visual: Spend a few minutes carefully examining the visual input. Identify the type of data presented, the units of measurement, and the key trends or patterns.
- Paraphrase: Never copy the language used in the task description or labels within the visual. Use synonyms and rephrase information to demonstrate your vocabulary range.
- Highlight Key Features: Don’t aim to describe every single detail. Focus on the most significant trends, changes, or comparisons presented in the data.
- Structure Your Response: Organize your writing logically. A common structure includes:
- Introduction: Briefly describe the type of visual and its main purpose.
- Overview: Summarize the most important overall trends or patterns.
- Body Paragraphs: Provide specific details and support your overview with data points.
- Practice Makes Perfect: Familiarize yourself with different types of visuals and practice writing responses under timed conditions.
Example:
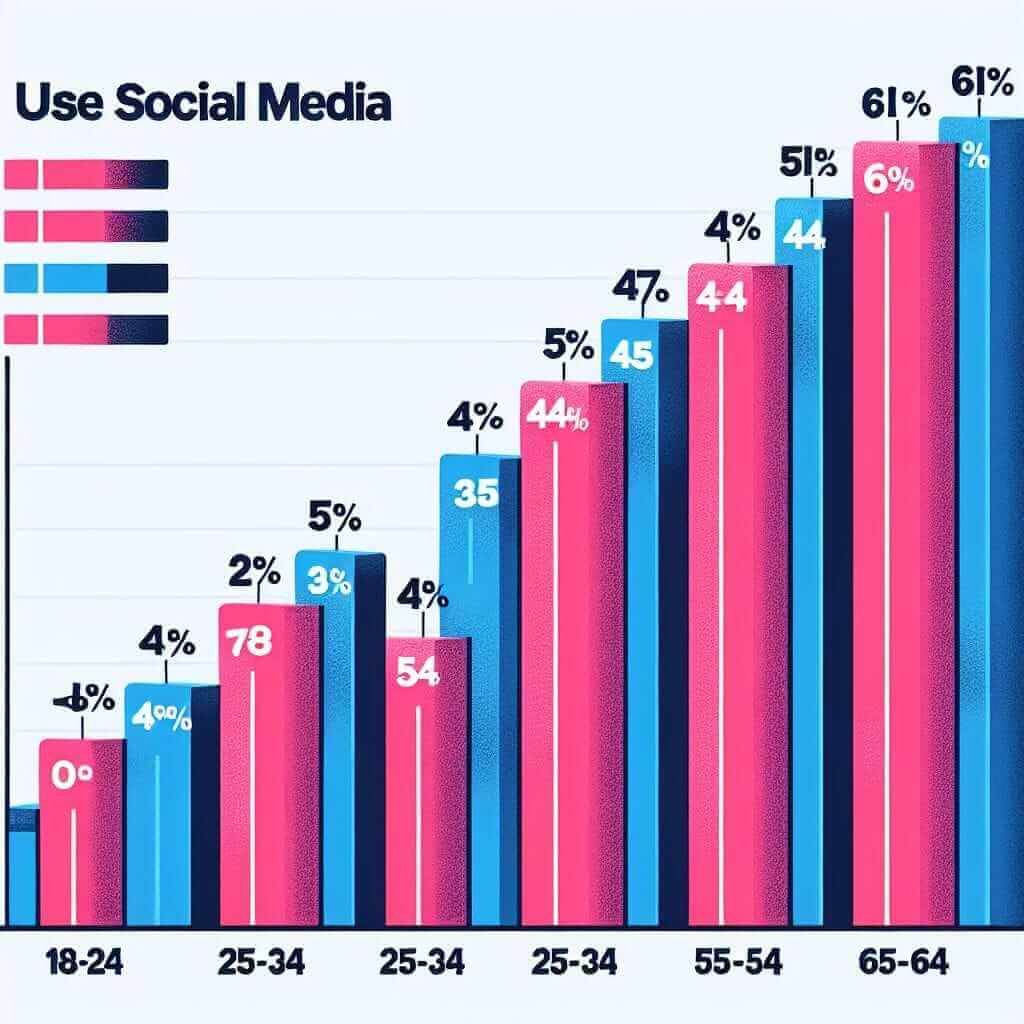
Let’s say you’re presented with a bar chart showing the percentage of people in different age groups who use social media. Your response could be structured like this:
- Introduction: The bar chart illustrates the proportion of individuals across various age ranges who engage with social media platforms.
- Overview: Overall, the data reveals that social media usage is most prevalent among younger generations, with a noticeable decline in engagement as age increases.
- Body Paragraph 1: Specifically, over 80% of individuals aged 18-24 report using social media, while this figure drops to 60% for those in the 35-44 age group.
- Body Paragraph 2: The lowest levels of social media engagement are observed among the oldest demographic, with less than 30% of those aged 65 and above reporting use of these platforms.
In Conclusion
Remember, success in Academic IELTS Writing Task 1 relies heavily on your ability to accurately and effectively communicate the information presented in the stimulus material. By understanding the importance of this visual input and employing key strategies, you can approach this section of the IELTS exam with confidence.