Electricity consumption by sector is a common topic in IELTS Writing Task 1. Candidates are often asked to describe and analyze data presented in graphs, charts, or tables. This task evaluates a candidate’s ability to interpret visual information and present it coherently. In this article, we delve into the topic, creating a detailed guide and providing a sample answer to help you achieve a high band score.
Common IELTS Task 1 Prompts Related to Electricity Consumption
Sample Prompts
- The graph below shows electricity consumption by different sectors in a country from 2000 to 2023. Summarize the information by selecting and reporting the main features, and make comparisons where relevant.
- The table below illustrates electricity usage in various sectors (residential, industrial, commercial, and agricultural) over the years 2000, 2010, and 2023. Summarize the data, highlighting any trends and significant changes.
- The chart below represents the distribution of electricity consumption across different sectors in 2000, 2010, and 2023. Describe the chart and provide an analysis of the changes over time.
Choosing a Prompt for Detailed Analysis
For this guide, we will focus on the first prompt about the graph showing electricity consumption by different sectors from 2000 to 2023. Let’s proceed with creating a visual representation, analyzing it, and drafting a sample answer.
Data and Graph Analysis
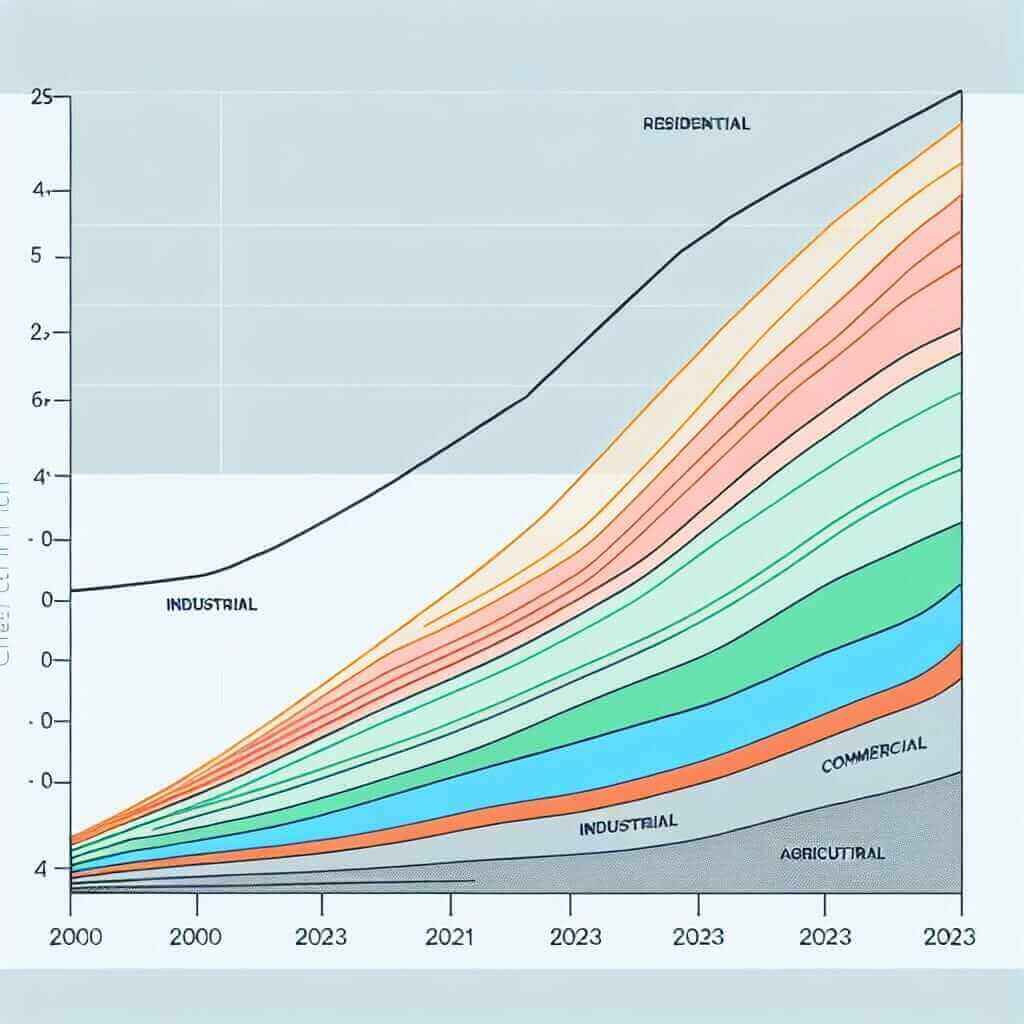
Imagine we have a line graph illustrating electricity consumption across four sectors: residential, industrial, commercial, and agricultural, from 2000 to 2023. Here’s a basic representation to help us visualize the data.
| Year | Residential (GWh) | Industrial (GWh) | Commercial (GWh) | Agricultural (GWh) |
|---|---|---|---|---|
| 2000 | 200 | 300 | 150 | 50 |
| 2005 | 250 | 350 | 200 | 60 |
| 2010 | 280 | 400 | 220 | 70 |
| 2015 | 300 | 450 | 270 | 75 |
| 2020 | 320 | 500 | 300 | 80 |
| 2023 | 350 | 550 | 340 | 85 |
Analysis of the Data:
- Residential Sector: Witnessed a steady increase from 200 GWh in 2000 to 350 GWh in 2023.
- Industrial Sector: This sector consistently consumed the most electricity, rising from 300 GWh in 2000 to 550 GWh in 2023.
- Commercial Sector: Showed considerable growth from 150 GWh in 2000 to 340 GWh in 2023.
- Agricultural Sector: Exhibited the least growth, with consumption rising from 50 GWh in 2000 to 85 GWh in 2023.

Sample IELTS Writing Task 1 Answer
In response to the prompt, here is a complete sample answer:
The graph illustrates the amount of electricity consumed in four different sectors—residential, industrial, commercial, and agricultural—from 2000 to 2023. Overall, all sectors showed an increasing trend in electricity consumption over the given period, with the industrial sector being the largest consumer.
In 2000, the industrial sector consumed the most electricity at 300 GWh, followed by the residential sector at 200 GWh, the commercial sector at 150 GWh, and the agricultural sector at 50 GWh. Over the next two decades, the industrial sector’s consumption rose continuously, reaching 550 GWh by 2023, maintaining its position as the largest consumer of electricity.
Meanwhile, the residential sector saw a steady increase in electricity usage, starting at 200 GWh in 2000 and climbing to 350 GWh by 2023. Similarly, the commercial sector’s consumption grew significantly, beginning at 150 GWh in 2000 and rising to 340 GWh in 2023.
The agricultural sector, although consuming the least amount of electricity throughout the period, also demonstrated a gradual upward trend, increasing from 50 GWh in 2000 to 85 GWh in 2023.
In conclusion, while all sectors experienced an upward trend in electricity consumption from 2000 to 2023, the industrial sector remained the most significant consumer, followed by the residential and commercial sectors, with the agricultural sector consuming the least.
Word Count: 210
Key Observations for Writing Task 1
When writing about graphs and charts in IELTS Writing Task 1:
- Include an Overview: Always start with an overview of the main trends.
- Detail Key Trends: Provide details on key trends and figures, making comparisons where necessary.
- Use Appropriate Vocabulary: Use a variety of vocabulary to avoid repetition.
- Be Clear and Coherent: Ensure your writing is clear, logical, and easy to follow.
Useful Vocabulary for This Topic
- Sector (noun) /ˈsɛktər/ – A distinct part or branch of a nation’s economy or society.
- Consumption (noun) /kənˈsʌmpʃən/ – The using up of a resource.
- Trend (noun) /trɛnd/ – A general direction in which something is developing or changing.
- Significant (adjective) /sɪɡˈnɪfɪkənt/ – Sufficiently great or important to be worthy of attention.
- Steady (adjective) /ˈstɛdi/ – Regular, even, and continuous in development.
- Considerable (adjective) /kənˈsɪdərəbəl/ – Notably large in size, amount, or extent.
- Gradual (adjective) /ˈɡrædʒuəl/ – Taking place or progressing slowly or by degrees.
- Upward (adjective) /ˈʌpwərd/ – Moving, pointing, or leading to a higher place or level.
- Maintain (verb) /meɪnˈteɪn/ – To keep something at the same level or rate.
- Distribution (noun) /ˌdɪstrəˈbjuʃən/ – The action of sharing something out among a number of recipients.
Conclusion
Describing data related to electricity consumption by sector entails understanding the trends and presenting them clearly. By focusing on the significant changes and utilizing appropriate academic language, one can effectively convey the information and achieve a high band score. Practice interpreting different types of graphs and charts, and pay attention to details for comprehensive and accurate descriptions.