The IELTS Writing Task 1 often presents candidates with visual data, requiring them to summarize and analyze the information in a clear and concise manner. One common type of visual data is a graph showcasing trends over time. A topic that frequently appears within this context is “Electricity Prices in Major Markets.” Understanding how to effectively describe and analyze such data is crucial for achieving a high band score.
This comprehensive guide will equip you with the necessary skills to confidently tackle IELTS Writing Task 1 questions related to electricity prices. We’ll delve into analyzing real-world data, crafting a band-worthy response, and exploring essential vocabulary and grammatical structures.
Sample IELTS Writing Task 1 Question
You should spend about 20 minutes on this task.
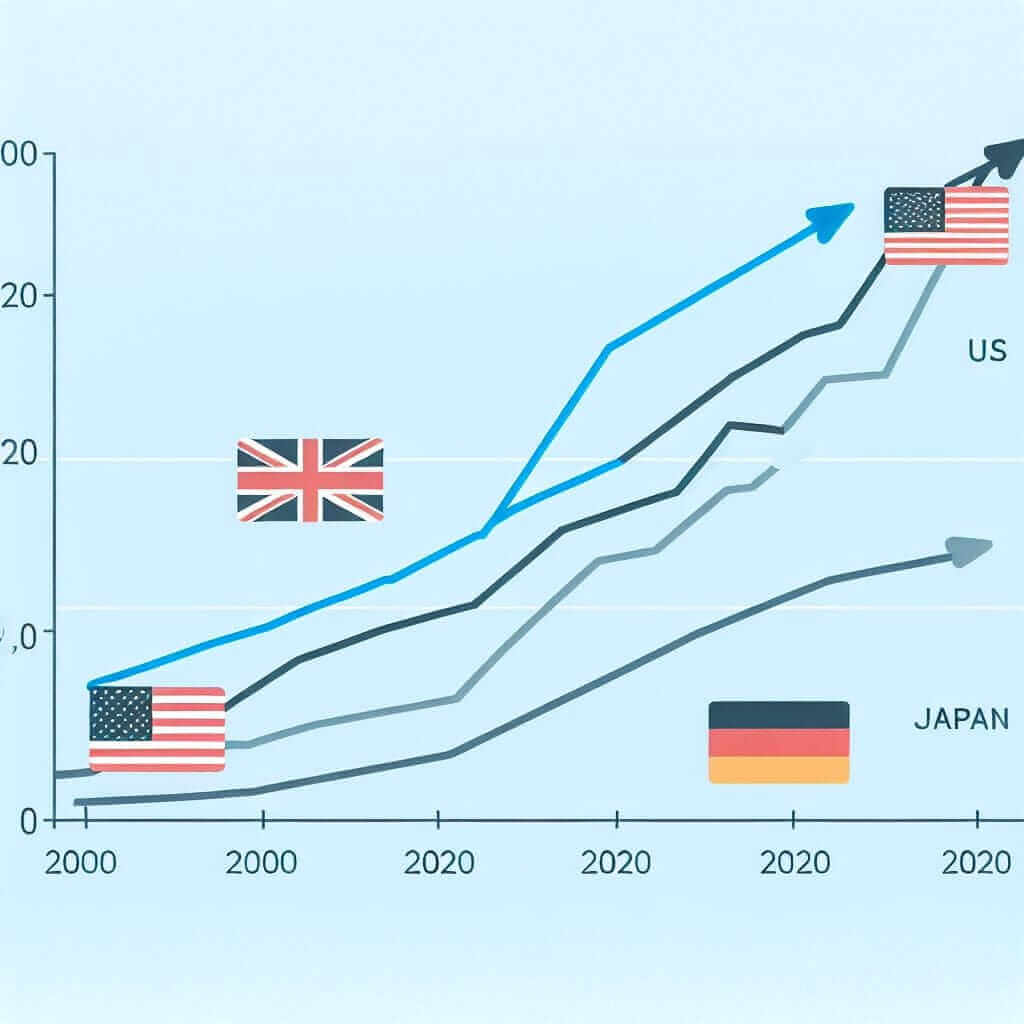
The graph below shows the average residential electricity prices in four different countries from 2000 to 2020.
Summarize the information by selecting and reporting the main features, and make comparisons where relevant.
Write at least 150 words.

Analyzing the Task and Data
Before we dive into writing, let’s dissect the task and data:
- Task Focus: You’re asked to summarize and compare electricity price trends in four countries over two decades.
- Data Type: A line graph is used to present the data.
- Key Information: Pay close attention to the starting and ending points for each country, any significant peaks or troughs, and overall trends (increasing, decreasing, fluctuating, stable).
Model Answer
The line graph illustrates the average residential electricity prices in four major economies – the USA, the UK, Germany, and Japan – over a twenty-year period from 2000 to 2020.
Overall, while electricity prices saw an upward trend in most of the countries surveyed, Germany experienced a notable decline over the same period.
At the beginning of the period, the USA had the lowest electricity price at approximately 5 cents per kilowatt-hour (kWh), followed by Japan, the UK, and Germany. Over the following decade, prices in the USA and the UK rose steadily, reaching around 12 cents/kWh and 17 cents/kWh respectively by 2010. In contrast, Japan saw a more gradual increase, with prices hovering around 15 cents/kWh for most of the period before climbing to 18 cents/kWh by 2020.
Germany presented a different picture altogether. Starting at the highest price point of 20 cents/kWh in 2000, Germany’s electricity prices gradually decreased, reaching parity with the UK at about 17 cents/kWh by 2020.
Word count: 168
Key Points and Language Use
- Overview: The response begins with a clear overview summarizing the main trends observed in the graph.
- Grouping Information: Countries with similar trends (increasing prices) are grouped together, while Germany, showing a contrasting trend, is discussed separately.
- Data Comparison: Comparisons are made throughout, highlighting the differences and similarities in electricity price trends among the four countries.
- Vocabulary: Specific vocabulary related to trends (upward trend, decline, gradual increase, hovering) and price fluctuations (reaching parity, climbing to) are used effectively.
Essential Vocabulary
- Fluctuate: To rise and fall irregularly in number or amount.
- Example: Electricity prices in the UK have fluctuated significantly over the past decade.
- Surge: A sudden and substantial increase.
- Example: There was a surge in electricity demand during the heatwave.
- Plummet: To decrease rapidly in value or amount.
- Example: Electricity prices plummeted after the introduction of renewable energy sources.
- Plateau: To reach a stable level after a period of growth.
- Example: Electricity consumption plateaued as energy efficiency measures were implemented.
- Outstrip: To exceed or surpass.
- Example: The growth of renewable energy is expected to outstrip that of fossil fuels in the coming years.
Conclusion
Mastering IELTS Writing Task 1 involves understanding how to analyze visual data accurately and present your findings in a well-structured, coherent manner. By familiarizing yourself with common graph types, practicing data interpretation, and developing a strong vocabulary for describing trends, you can significantly improve your chances of achieving a high band score. Remember to focus on clarity, accuracy, and effective comparisons to create a compelling and informative response.