The dichotomy between employment in agricultural and industrial sectors has always been a topic of considerable interest, particularly in developing and transitioning economies. Not only does this reflect broader economic transitions, but it also influences social dynamics and development patterns. In the IELTS Writing Task 1, you might encounter questions that ask you to compare data over time, such as employment rates in different sectors. Today, we’ll dive deep into this topic, providing insights, vocabulary, grammar, and strategies to ace this type of question.
Understanding the Task
Let’s start by presenting a couple of hypothetical IELTS Writing Task 1 prompts related to our theme:
-
Prompt 1: “The graph below shows the percentage of employment in agricultural and industrial sectors from 2000 to 2023.”
-
Prompt 2: “The table below illustrates the number of employees in agricultural and industrial sectors in three different countries from 2000 to 2023.”
We’ll choose one of these prompts to create a sample response, but first, let’s review the key steps and skills needed to write effectively.
Data Presentation: Hypothetical Graph
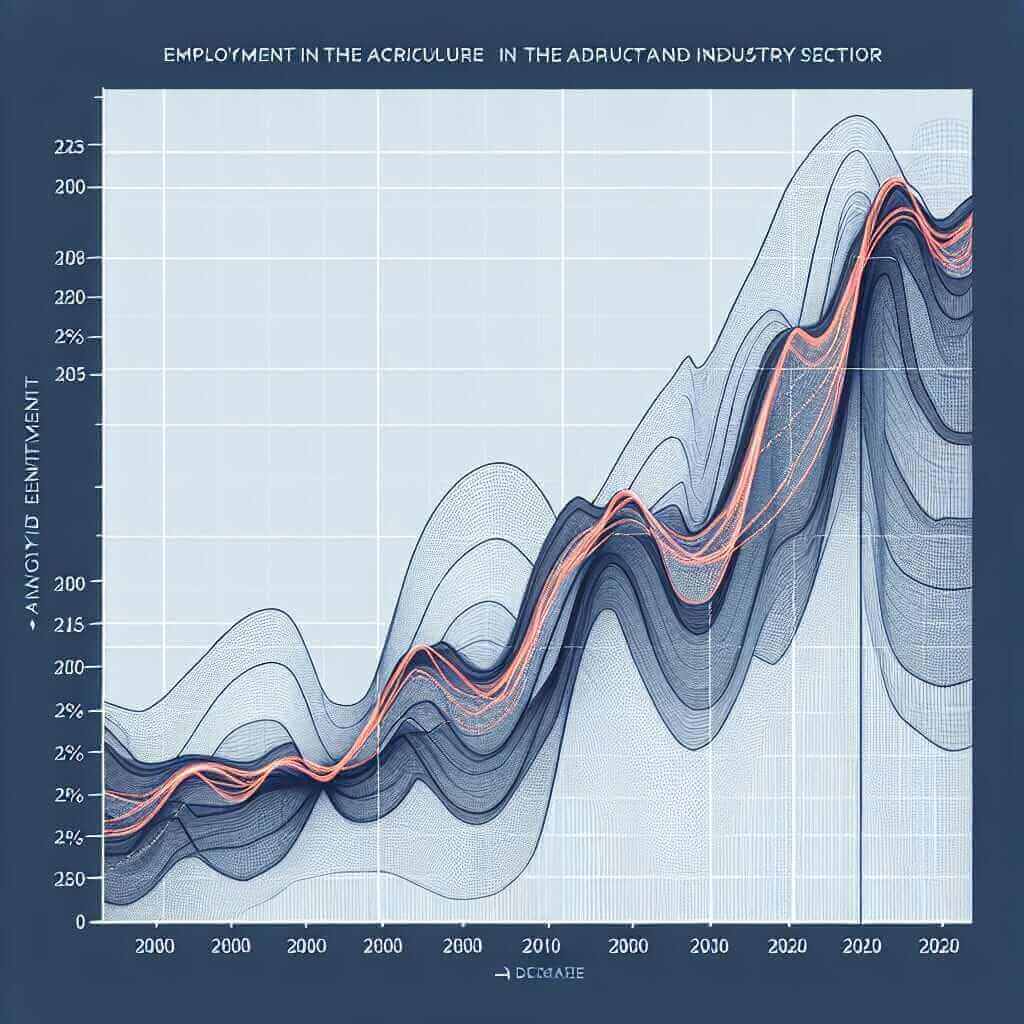
This graph shows the percentage of employment in agricultural and industrial sectors from 2000 to 2023.

Analysis of the Prompt
Step 1: Identify Key Features and Trends
- Agricultural Sector: The percentage of employment decreases steadily from 60% in 2000 to 25% in 2023.
- Industrial Sector: Shows a significant rise from 20% in 2000 to 50% in 2023, starting with a slow increase and then accelerating after 2010.
Step 2: Categorize Data
- Overall Trends: General decrease in agriculture and increase in industry.
- Notable Points: Points of major change or acceleration (e.g., post-2010).
Sample Writing Task 1 Response
Sample Answer:
The graph provides a comparative analysis of employment percentages in agricultural and industrial sectors between 2000 and 2023. Overall, the data illustrates a significant shift from agricultural to industrial employment over the given period.
In 2000, the agricultural sector employed the majority of the workforce, with a substantial 60%. However, this figure experienced a consistent decline over the years, dropping sharply after 2010 and culminating at 25% in 2023. This downward trend highlights the economy’s gradual movement away from agriculture.
Conversely, the industrial sector showcased an opposing trend. Starting at 20% in 2000, employment in this sector remained relatively stable for the first decade. From 2010 onwards, there was a marked acceleration in industrial employment, culminating at 50% by 2023. This indicates a robust industrial growth phase during this period.
The data clearly indicates a major economic transformation, with the workforce moving away from agriculture towards industrial employment between 2000 and 2023. The industrial sector’s substantial growth juxtaposed with agriculture’s decline underscores a significant structural shift in employment patterns.
(Word count: 179)
Key Points to Remember
Vocabulary
- Dichotomy (noun): Division into two sharply contrasting groups.
(Example: The dichotomy between industrial and agricultural employment is evident.) - Culminate (verb): Reach a climax or point of highest development.
(Example: The percentage of industrial employment culminated at 50% in 2023.) - Shift (noun): A change in position, direction, or tendency.
(Example: The shift from agricultural to industrial employment is notable.) - Substantial (adj): Of considerable importance, size, or worth.
(Example: There was a substantial increase in industrial employment.) - Gradual (adj): Taking place or progressing slowly or by degrees.
(Example: The agricultural sector saw a gradual decline over the period.)
Grammar Focus
Comparisons
- Comparative Forms: Use adjectives with “more/less” for comparisons.
(Example: Employment in agriculture declined more rapidly after 2010.)
Trends and Data Description
- Present Simple for Facts and General Trends.
(Example: The agricultural sector employs fewer people now.) - Past Tense for Specific Data Points in Time.
(Example: In 2000, employment in agriculture was at 60%.)
Tips for Writing Task 1
- Carefully Analyze the Data: Identify key trends, peaks, and troughs.
- Organize by Time or Category: Keep your paragraphs focused on either time sequences or thematic categories.
- Use Relevant Vocabulary: Adopt varied vocabulary to describe increases, decreases, and stability.
- Check Grammar and Spelling: Ensure your writing is error-free for higher band scores.
- Practice Word Limits: Stay within the 150-200 word range.
Conclusion
By following these guidelines, analyzing the data accurately, and employing a robust vocabulary, you can master the IELTS Writing Task 1. Remember, practice and a critical eye on details are key to achieving a Band 7+ score.