The IELTS Writing Task 1 often presents data in various forms, requiring test-takers to interpret and summarize the information effectively. One common theme is analyzing trends related to energy consumption. Understanding how energy sources have evolved and their impact is crucial for achieving a high band score. This article provides a comprehensive guide to tackling IELTS Writing Task 1 questions focusing on “Energy Consumption by Source (1980-2023),” complete with sample answers, vocabulary tips, and expert insights.
Nội dung bài viết
Sample IELTS Writing Task 1 Question:
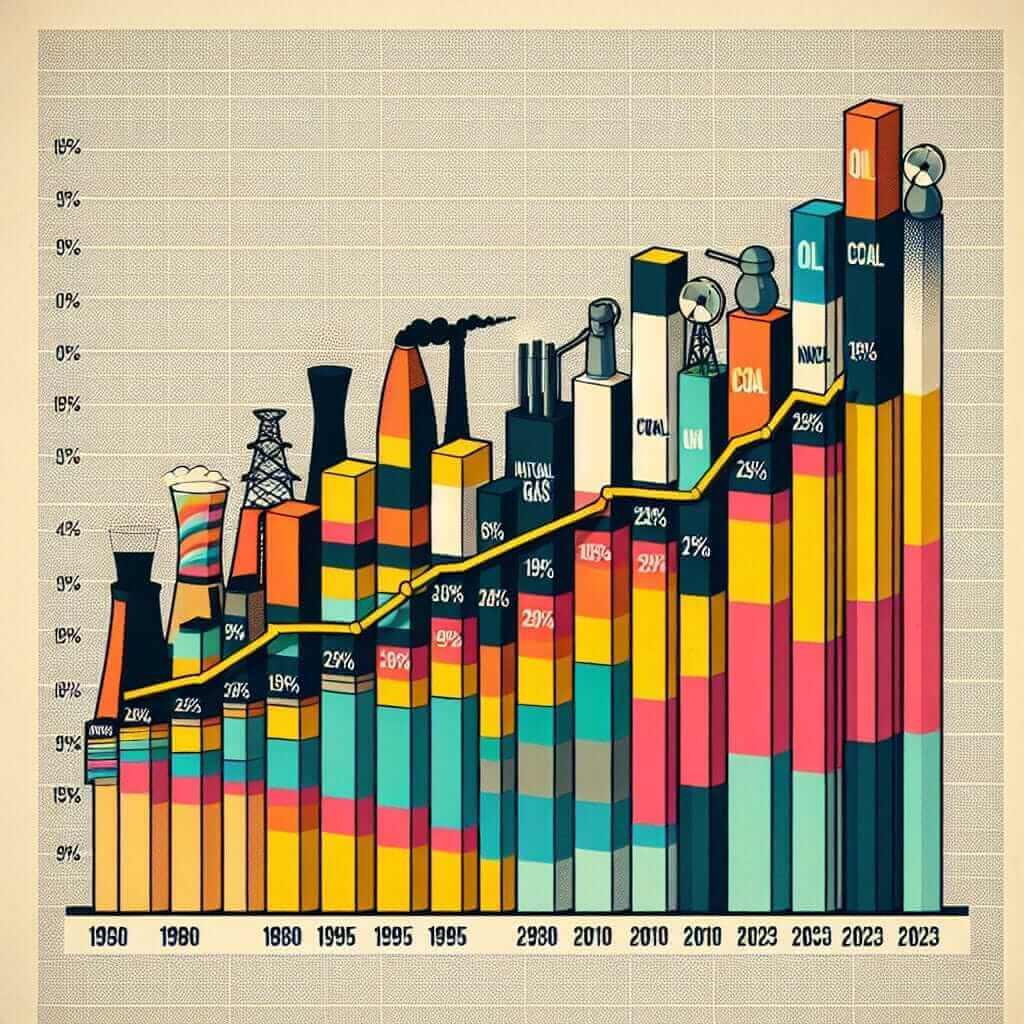
The chart below shows the changes in energy consumption from different sources in a particular country between 1980 and 2023. Summarize the information by selecting and reporting the main features and make comparisons where relevant.

Data Analysis:
Before writing, carefully analyze the provided chart:
- Identify the variables: The chart illustrates the percentage of total energy consumption derived from five sources: oil, natural gas, coal, nuclear, and renewables.
- Time frame: The data spans four specific years: 1980, 1995, 2010, and 2023.
- Key Trends: Look for overall patterns, such as increases, decreases, fluctuations, or significant changes in proportions.
Sample Answer (Band 7+):
The bar chart presents a compelling overview of how energy consumption patterns have shifted in a particular country over a 43-year period.
In 1980, oil dominated the energy mix, accounting for just over half of the total consumption. Coal and natural gas followed, contributing roughly 25% and 20% respectively. Nuclear and renewable energy sources played a relatively minor role at this time.
By 1995, natural gas consumption had surpassed that of coal, indicating a growing preference for this fuel source. Oil remained the dominant source, although its share had slightly declined.
Moving to 2010, a more dramatic shift is evident. While oil continued its gradual decline, natural gas usage further increased, becoming the primary energy source. Renewables began to show more significant growth, albeit from a small base.
Finally, in 2023, the trend towards cleaner energy sources is undeniable. Natural gas maintained its leading position, but renewables witnessed a substantial surge in consumption, nearly equalling coal’s contribution. This suggests a concerted effort to diversify the energy mix and reduce reliance on fossil fuels.
In conclusion, the chart reveals a clear transition in energy consumption patterns, moving away from a heavy reliance on oil and coal towards a more diversified mix that includes natural gas and, increasingly, renewable energy sources. (Word count: 198)
Writing Tips for IELTS Task 1:
- Paraphrase the question: Avoid directly copying the question wording in your introduction. Use synonyms and rephrase to demonstrate vocabulary range.
- Overview: Provide a concise overview summarizing the main trends in the second paragraph. This helps the examiner quickly grasp the key takeaways.
- Group data effectively: Instead of describing each year separately, group information based on similarities or significant changes.
- Use linking words: Employ a variety of cohesive devices (e.g., however, furthermore, in contrast) to ensure a smooth flow of information and to highlight relationships between data points.
- Data accuracy: Report data accurately and avoid making subjective interpretations or drawing conclusions that are not supported by the chart.
- Vocabulary for describing trends: Utilize precise language to describe increases (surged, soared), decreases (plummeted, dwindled), fluctuations (oscillated, fluctuated), and stability (remained stable, plateaued).
Essential Vocabulary:
- Consumption (n.) /kənˈsʌmp.ʃən/: the act of using energy, food, or materials.
- Dominate (v.) /ˈdɑː.mə.neɪt/: to be the largest, most important, or most noticeable part of something.
- Renewable (adj.) /rɪˈnuː.ə.bəl/: describes a form of energy that can be produced as quickly as it is used.
- Fossil fuels (n.) /ˈfɑː.səl ˌfjuːlz/: fuels, such as gas, coal, and oil, that were formed underground from plant and animal remains millions of years ago.
- Trend (n.) /trend/: a general development or change in a situation or in the way that people are behaving.
- Proportion (n.) /prəˈpɔːr.ʃən/: the number or amount of a group or part of something when compared to the whole.
- Significant (adj.) /sɪɡˈnɪf.ɪ.kənt/: large or important enough to be noticed.
- Gradual (adj.) /ˈɡrædʒ.u.əl/: happening or changing slowly over a long period of time.
Conclusion:
Successfully analyzing and writing about energy consumption trends requires a combination of data interpretation skills, vocabulary precision, and a clear understanding of IELTS writing conventions. By practicing these strategies and familiarizing yourself with relevant terminology, you can confidently approach data-based writing tasks and strive for a Band 7+ score.