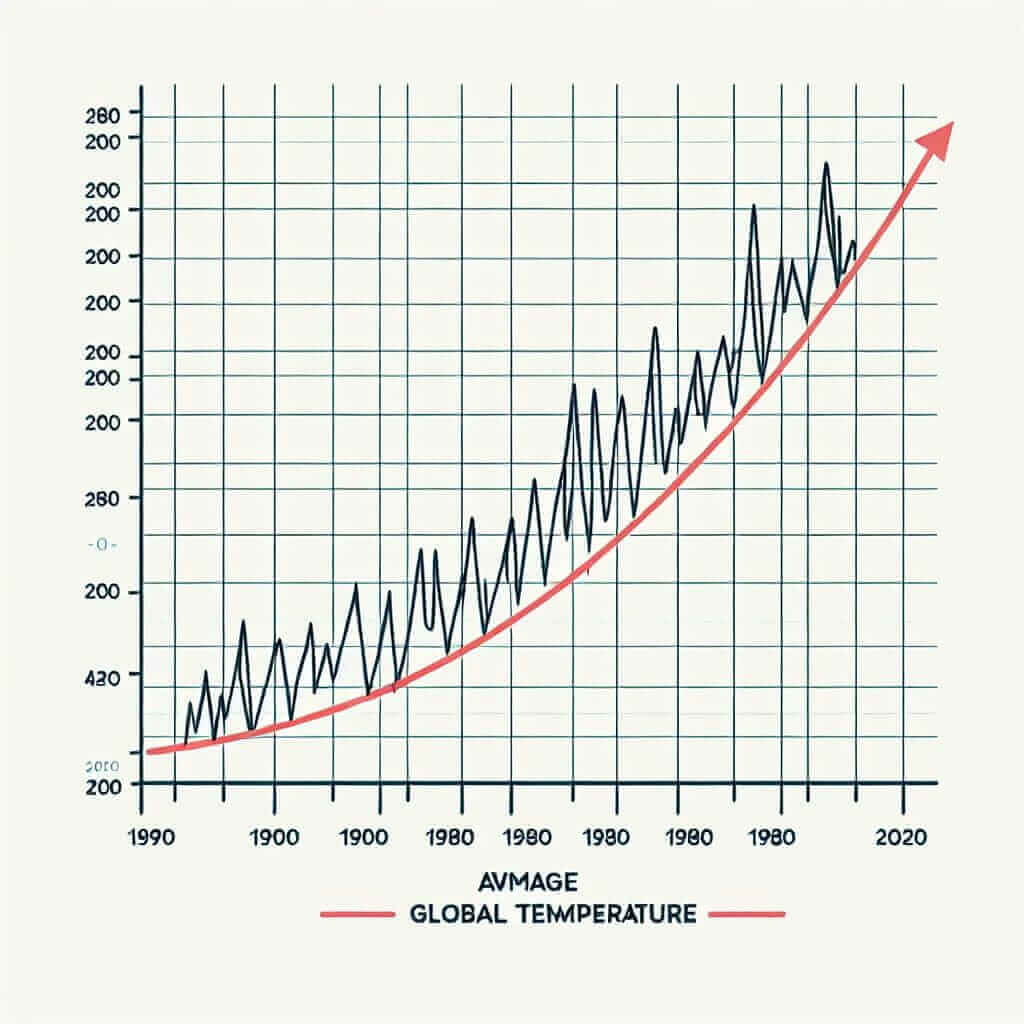
“Global Temperature Changes” is a recurring theme in the IELTS exam, particularly in Writing Task 1. This topic aligns with the IELTS test’s objective of assessing your ability to understand and articulate information presented visually. Expect to encounter line graphs, bar charts, or even maps illustrating temperature trends over time and across regions.
Here are some potential IELTS Writing Task 1 prompts related to this topic:
- The line graph shows average global temperatures from 1900 to 2020. Summarize the information by selecting and reporting the main features and making comparisons where relevant.
- The bar chart compares the average temperature increase in different regions of the world between 1900 and 2020. Summarize the information by selecting and reporting the main features and making comparisons where relevant.
- The map illustrates the projected temperature changes in different parts of the world by 2100. Summarize the information by selecting and reporting the main features and making comparisons where relevant.
Sample Task and Model Answer
Let’s focus on a line graph prompt:
The line graph below shows the average global temperature change from 1900 to 2020. Summarize the information by selecting and reporting the main features and making comparisons where relevant.

Analysis of the Task
This task requires you to:
- Identify the main features: The overall trend, any significant increases or decreases, and any periods of stability.
- Make comparisons: Compare temperature changes over different periods.
- Summarize: Present the information concisely and accurately.
Model Answer (approximately 170 words)
The line graph depicts the change in average global temperature from 1900 to 2020. Overall, there has been a clear upward trend in global temperatures over the 120-year period.
At the beginning of the 20th century, the average global temperature was relatively stable, hovering around 13.7 degrees Celsius. This stability continued until the mid-1900s, after which a gradual increase in temperature is observed. However, from the 1980s onwards, the rate of temperature increase accelerated significantly.
By 2020, the average global temperature had risen to approximately 14.9 degrees Celsius, representing an increase of about 1.2 degrees Celsius compared to the start of the 20th century. This marked increase in the latter part of the period indicates a concerning acceleration in global warming.
Key Points for Writing
- Structure: Introduction, Overview, Body Paragraph(s) describing key features and comparisons, Conclusion (optional).
- Tenses: Use the past tense for historical data and the present tense for general statements about the graph.
- Vocabulary: Employ a range of vocabulary related to trends (increase, decrease, fluctuate, rise, fall, plateau, etc.) and comparisons (whereas, while, in contrast, similarly, etc.).
- Data Accuracy: Report the data accurately and use appropriate units of measurement.
Useful Vocabulary
- Fluctuate (v.) /ˈflʌktʃueɪt/: To rise and fall irregularly in number or amount.
- Plateau (n.) /ˈplætəʊ/: A period or state of little or no change following a period of activity or progress.
- Steep (adj.) /stiːp/: Rising or falling sharply.
- Acceleration (n.) /əkˌseləˈreɪʃn/: Increase in the rate or speed of something.
- Concerning (adj.) /kənˈsɜːnɪŋ/: Causing worry or anxiety.
Conclusion
Mastering the “Global Temperature Changes” theme in IELTS Writing Task 1 requires a strong understanding of data interpretation, vocabulary related to trends, and clear, concise writing. By practicing with sample tasks and incorporating the strategies outlined above, you can confidently approach this topic and achieve your desired band score.