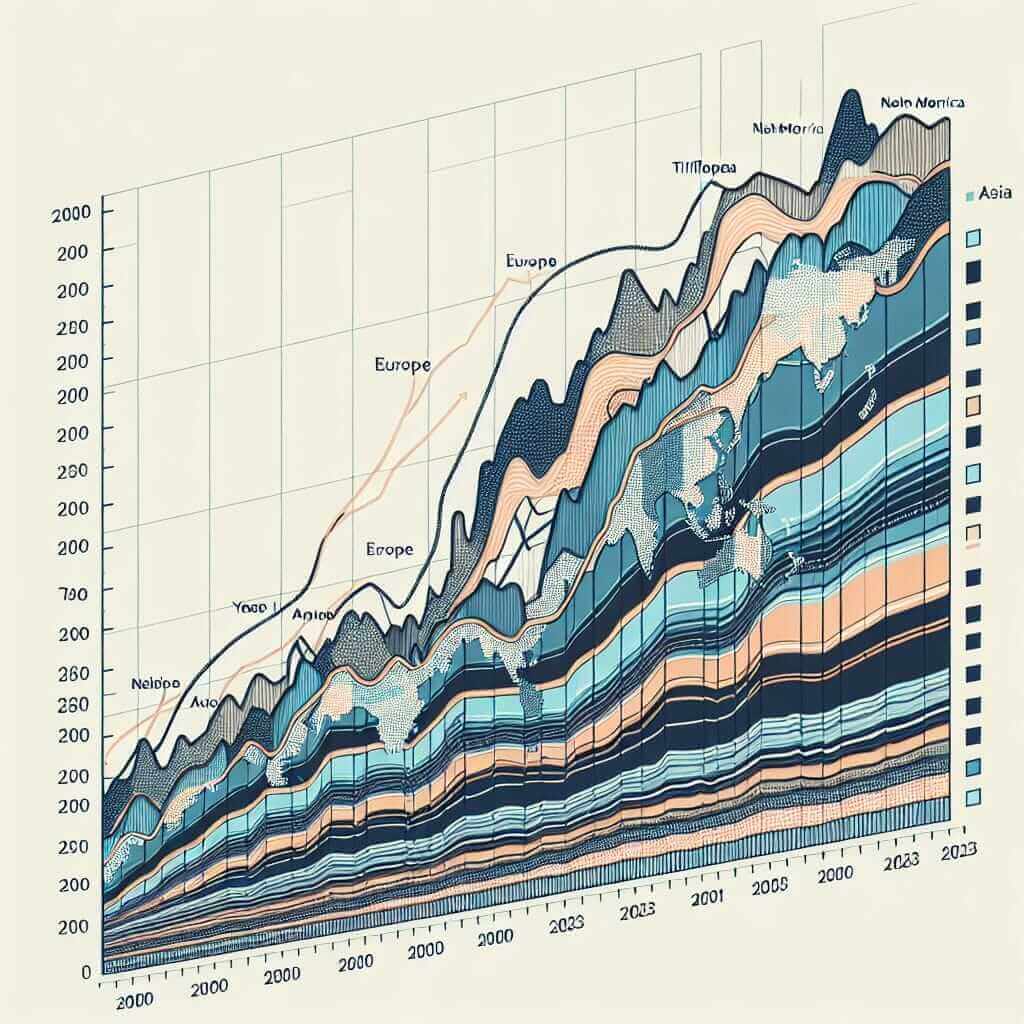
The IELTS Writing Task 1 often presents data in various forms, and one common type is a line graph. Understanding how to effectively analyze and write about line graphs, especially those depicting trends over time, is crucial for achieving a high band score. This article focuses on “Global Trade Volume by Region (2000-2023)”, a topic frequently appearing in IELTS Writing Task 1. We’ll delve into understanding the nuances of this topic, analyzing relevant vocabulary, and crafting a band-scoring response.
Understanding the Topic: Global Trade Volume
Before we dive into the writing task, let’s establish a clear understanding of what “Global Trade Volume by Region” entails:
- Global Trade Volume: This refers to the total value of goods and services exchanged between countries worldwide within a specific period.
- By Region: This indicates that the data will be categorized and presented based on different geographical regions (e.g., North America, Europe, Asia).
- (2000-2023): This time frame sets the context for observing trends and changes in global trade patterns.
Potential IELTS Writing Task 1 Questions
Here are a few potential IELTS Writing Task 1 questions that could be based on this topic:
- The line graph below shows the global trade volume by region from 2000 to 2023. Summarize the information by selecting and reporting the main features and make comparisons where relevant.
- The chart illustrates the changes in the volume of international trade in different regions of the world over a 23-year period (2000-2023). Write a report for a university lecturer describing the information shown below.
- Analyze the line graph depicting trends in global trade volume across various regions from 2000 to 2023, and provide a detailed overview of the key observations.
Sample IELTS Writing Task 1 Question & Data
Let’s choose the first question for our sample task:
The line graph below shows the global trade volume by region from 2000 to 2023. Summarize the information by selecting and reporting the main features and make comparisons where relevant.

Analyzing the Task
- Type of graph: Line graph
- Key information: Global trade volume, different regions, time period (2000-2023)
- Task: Summarize the main features, make comparisons
Model Answer
The line graph illustrates the trends in global trade volume across different regions from 2000 to 2023. Overall, global trade experienced significant growth during this period, with Asia emerging as the dominant trading region.
At the beginning of the period, North America held the largest share of global trade, standing at approximately $4 trillion. However, this figure gradually declined over the next decade, reaching around $3.5 trillion by 2010. In contrast, Asia’s trade volume showed a steady upward trend, starting at $2 trillion in 2000 and surpassing North America in 2008 to reach an impressive $8 trillion by 2023.
Europe displayed a relatively stable trade volume, hovering around $3 trillion for most of the period. It experienced a slight dip in 2009 but recovered quickly thereafter. Other regions, while showing growth in trade volume, remained significantly lower than the top three regions throughout the period.
In conclusion, the global trade landscape witnessed a major shift in dominance from North America to Asia, with Asia experiencing remarkable growth. While other regions also participated in international trade, their contributions remained relatively small compared to the leading players. (Word count: 176)
Writing Tips and Vocabulary
- Paraphrasing: Avoid simply copying the words from the question. Use synonyms and different sentence structures.
- Tenses: Use the appropriate tense (past simple, present perfect, etc.) to describe the trends.
- Data Selection: Don’t try to describe every single detail. Focus on the most significant trends and comparisons.
- Linking Words: Use linking words (however, in contrast, furthermore, etc.) to connect your ideas and make your writing flow smoothly.
Essential Vocabulary
Here are some useful words and phrases for describing trends in IELTS Writing Task 1:
- Increase: rise, surge, grow, climb, soar, escalate
- Decrease: decline, fall, drop, decrease, plummet, plunge
- Fluctuate: vary, oscillate, go up and down
- Stable: remain constant, level off, stabilize
- Reach a peak: peak, reach its highest point
- Hit a low: bottom out, reach its lowest point
Remember to use these words in the correct grammatical context and ensure they fit the data you are describing.
Conclusion
Mastering the IELTS Writing Task 1 requires a good understanding of data interpretation, vocabulary, and grammar. By practicing regularly with different types of graphs and familiarizing yourself with common IELTS topics like “Global Trade Volume by Region,” you can significantly improve your writing skills and boost your confidence for the exam. Remember to analyze the data carefully, plan your response, and use a variety of vocabulary and grammatical structures to present a clear, concise, and accurate report.