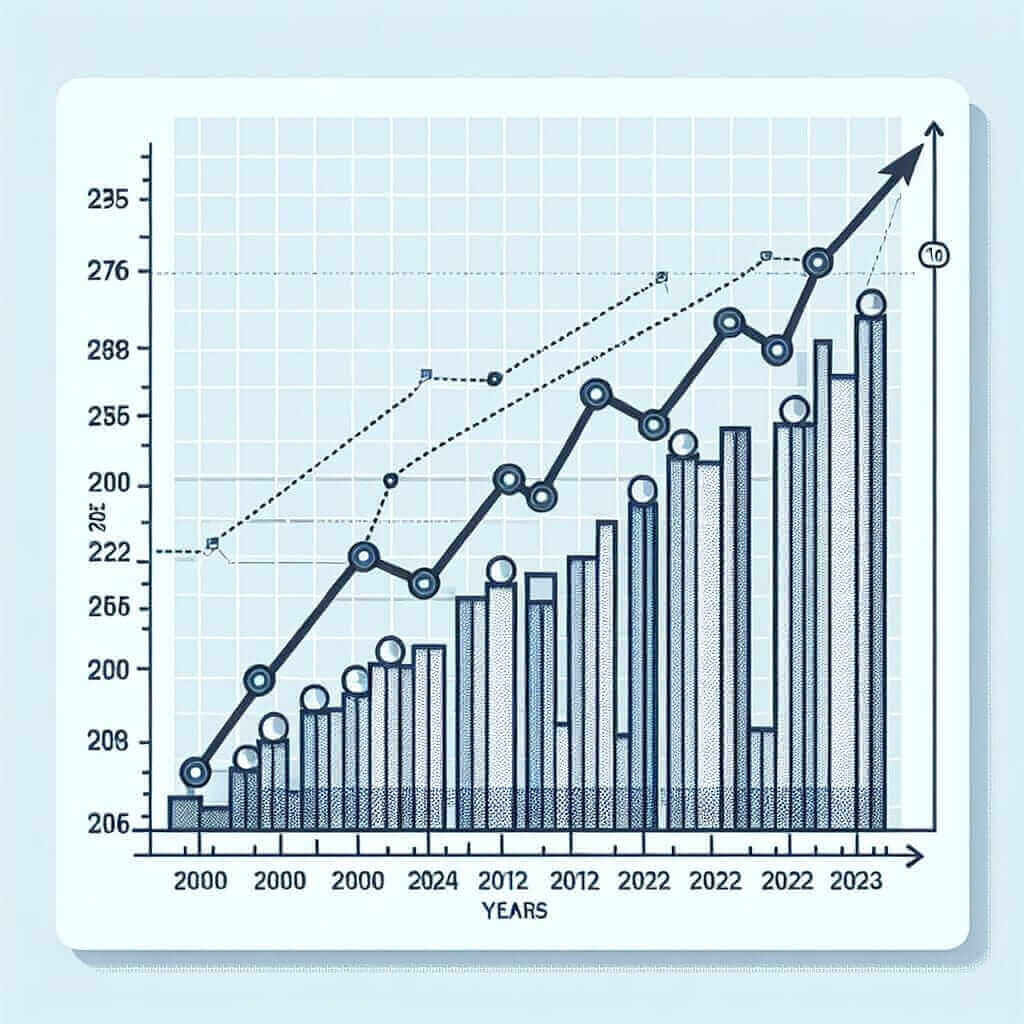
Graduation rates in universities are a crucial indicator of educational success and efficiency. For IELTS candidates, this topic is particularly relevant for Writing Task 1, where data interpretation and analysis skills are tested. Let’s dive into creating a comprehensive guide to help you excel in this task.
Overview of Graduation Rates in Universities
Graduation rates reflect the percentage of students who complete their programs within a given timeframe. Understanding this data involves interpreting charts, graphs, and tables, typically provided in Writing Task 1. Here, we will not only gather data but also create a sample question, analyze it, and offer a model answer.
To start, let’s present sample questions:
Sample Questions:
- The line graph below shows graduation rates in universities from 2000 to 2023.
- The bar chart illustrates the graduation rates in public and private universities between 2000 and 2023.
- The table gives information on the graduation rates in different fields of study at universities from 2000 to 2023.
For this guide, we will use the first sample question.
Creating and Analyzing the Data
Line Graph: Graduation Rates in Universities (2000-2023)
(Note: As we're working with markdown, envision a sample line graph here depicting graduation rates over the specified period.)

Year       | Graduation Rate (%)
-----------|---------------------
2000       | 50
2002       | 52
2005       | 55
2008       | 58
2010       | 60
2013       | 62
2015       | 65
2018       | 68
2020       | 70
2023       | 72
Analyzing the Task
Task Analysis:
- Identify the main trends: overall increase in graduation rates.
- Note significant fluctuations or steady growth.
- Highlight comparisons between different years or periods.
Model Answer
Writing Task 1 Sample Answer
The line graph illustrates the graduation rates in universities from the year 2000 to 2023. The data reveals a general upward trend in the percentage of students graduating from universities over the given period.
In the year 2000, the graduation rate stood at 50%. This figure remained relatively steady until 2002, when there was a slight increase to 52%. The subsequent years showed a gradual rise, reaching 55% in 2005 and 58% in 2008.
By 2010, the rate had climbed to 60%, continuing its steady ascent to 62% in 2013 and 65% by 2015. The most significant increase occurred between 2015 and 2020, with the graduation rate reaching 70%. In the final year of the data, 2023, the percentage of graduates peaked at 72%.
Overall, the graph indicates a consistent improvement in graduation rates from 2000 to 2023, suggesting enhanced educational effectiveness and perhaps better student support mechanisms over the years.
Word Count: 162
Tips for Writing Task 1
Vocabulary and Grammar
Vocabulary:
- Upward trend (noun): an increase in the value of a variable.
- Fluctuations (noun): irregular rising and falling in number or amount.
- Ascent (noun): a climb or rise to a higher point.
- Percentage (noun): a rate, number, or amount in each hundred.
- Peak (verb/noun): reach the highest point, either of a specified value or a condition.
Grammar Structures:
- Comparative forms: used for making comparisons between different data points.
- Example: “The graduation rate in 2023 was significantly higher than in 2000.”
- Passive voice: useful for emphasizing results.
- Example: “The rate has been increased gradually over the years.”
Useful Tips
- Time Management: Spend about 20 minutes on Task 1 to keep enough time for Task 2.
- Structure: Follow a clear structure – Introduction, Overview, and Detailed Comparison.
- Paraphrasing: Ensure you paraphrase the task prompt to avoid repetition.
- Data Reporting: Use appropriate vocabulary to describe data trends.
- Accuracy: Be precise with the figures to avoid misrepresentation.
Conclusion
Understanding and analyzing university graduation rates from 2000 to 2023 is an essential skill for IELTS Writing Task 1. By focusing on key trends, employing precise vocabulary, and structuring your response effectively, you can achieve a high band score. Remember to practice regularly with a variety of data sets to enhance your analytical skills.
Good luck with your IELTS preparation!