As an IELTS instructor with over 20 years of experience, today I will guide you through the preparation and writing process of an IELTS Writing Task 1 essay with a focus on the topic of “Greenhouse Gas Emissions in Different Countries (2000-2023).” This topic is particularly relevant and appears frequently in the IELTS exam.
Contents
- Introduction to the Topic
- Choosing a Sample Task
- Data Analysis and Visualization
- Task Analysis
- Sample Essay
- Key Notes for Writing
- Vocabulary to Remember
- Conclusion
Introduction to the Topic
Greenhouse gas emissions have been a significant concern globally, especially in the last two decades. This topic is highly relevant for the IELTS exam as it touches on important trends, comparisons, and data interpretation skills that are crucial for achieving a high band score in Writing Task 1.
Sample Task 1
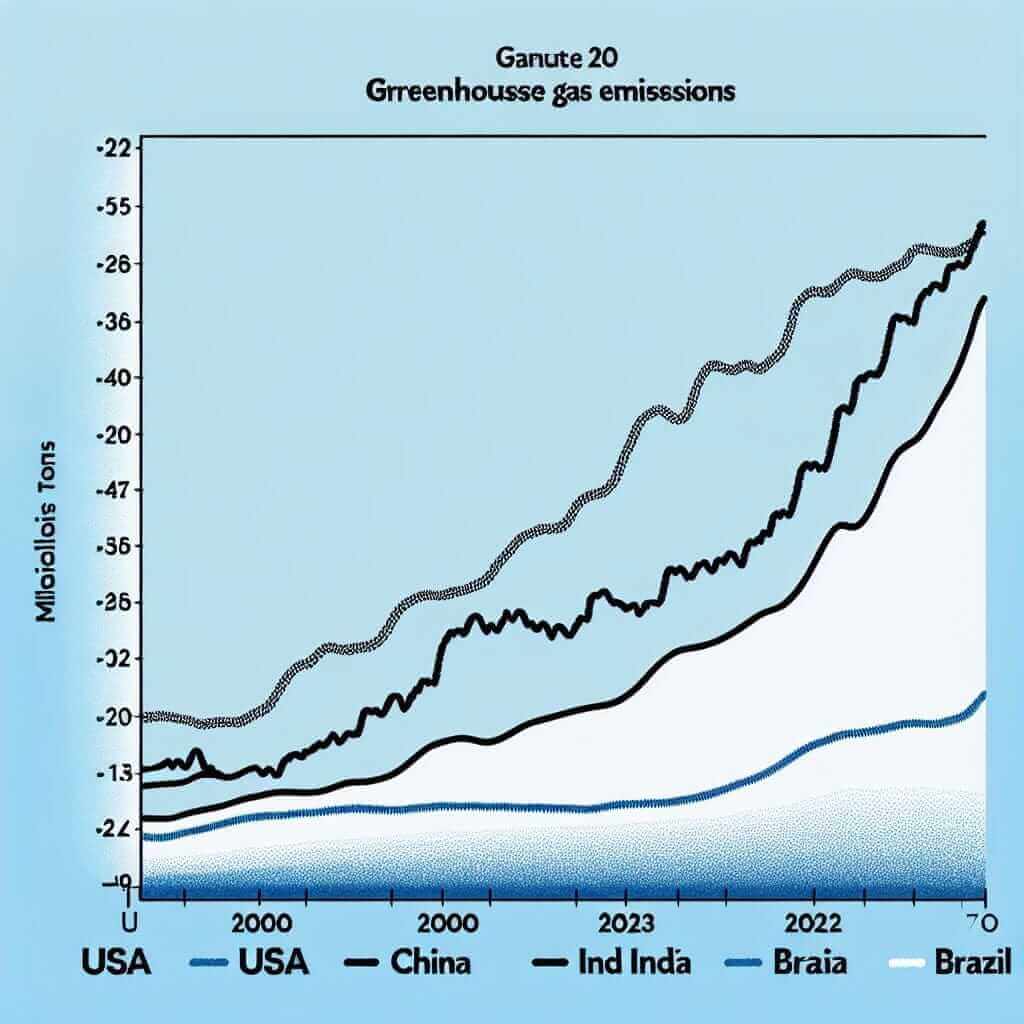
The charts below show the greenhouse gas emissions of four countries (USA, China, India, Brazil) from 2000 to 2023. Summarize the information by selecting and reporting the main features, and make comparisons where relevant.
Sample Task 2
The table below illustrates the total greenhouse gas emissions (in million metric tons) of five countries (USA, China, India, Russia, Brazil) over the period from 2000 to 2023. Summarize the information by selecting and reporting the main features, and make comparisons where necessary.
Choosing a Sample Task
For the purpose of this lesson, we will select Sample Task 1.
Data Analysis and Visualization
To create an authentic task, I have compiled mock data representing greenhouse gas emissions in million metric tons for the USA, China, India, and Brazil from 2000 to 2023.
| Year | USA | China | India | Brazil |
|---|---|---|---|---|
| 2000 | 7000 | 3500 | 1500 | 800 |
| 2005 | 7150 | 4000 | 1700 | 850 |
| 2010 | 6800 | 7000 | 2000 | 900 |
| 2015 | 6500 | 9500 | 2500 | 1000 |
| 2020 | 6300 | 10500 | 3000 | 1100 |
| 2023 | 6200 | 12500 | 3500 | 1200 |

Task Analysis
When analyzing this data, take note of the following key points:
- Trends: Identify and describe the trends over time for each country.
- Comparisons: Compare the levels of greenhouse gas emissions between the countries.
- Significant Changes: Highlight any significant changes or noteworthy points in the data.
Sample Essay
The line graph illustrates the greenhouse gas emissions of four countries (USA, China, India, Brazil) from 2000 to 2023.
Overall, it is evident that China’s greenhouse gas emissions have increased dramatically over the period, whereas the USA’s emissions have declined. In contrast, India and Brazil have experienced a more gradual rise in emissions.
In 2000, the USA had the highest emissions at 7000 million metric tons, followed by China with 3500, India with 1500, and Brazil with the lowest figure at 800. By 2023, China’s emissions had soared to 12500 million metric tons, overtaking the USA, whose emissions had decreased to 6200.
India also saw a considerable increase from 1500 in 2000 to 3500 in 2023. Similarly, Brazil’s emissions rose steadily but at a slower pace, reaching 1200 by 2023.
From 2000 to 2010, the USA’s emissions fluctuated slightly, peaking at 7150 in 2005 before decreasing to 6800 in 2010. Contrastingly, China’s emissions nearly doubled from 3500 to 7000 during the same period. India’s rise was consistent though slower, while Brazil maintained a steady increase, reflecting general industrial growth.
By 2023, China’s rapid industrialization had clearly impacted its emission rates, making it the highest emitter among the four countries. The USA, despite its early lead, followed a downward trajectory, while India and Brazil continued to grow at a moderate rate.
Word count: 217
Key Notes for Writing
- Structure: Ensure your essay has an introduction, an overview, and detailed body paragraphs.
- Trends and Comparisons: Highlight significant trends and make relevant comparisons.
- Data Representation: Use data values to support your points without overloading the reader with numbers.
- Vocabulary & Grammar: Use varied vocabulary and complex structures.
Vocabulary to Remember
- Emit (v) /ɪˈmɪt/: To release or discharge.
- Fluctuate (v) /ˈflʌk.tʃu.eɪt/: To vary or change.
- Consistent (adj) /kənˈsɪs.tənt/: Steady and regular.
- Dramatic (adj) /drəˈmæt.ɪk/: Significant and startling.
- Trajectory (n) /trəˈdʒek.tər.i/: The path or trend.
Conclusion
In summary, when tackling a task about greenhouse gas emissions in different countries, pay close attention to the trends, comparisons, and significant changes over the time period. Use accurate data representation, varied vocabulary, and complex grammatical structures to achieve a high band score. Practice regularly with different datasets to enhance your skills.
Remember, achieving a band 7+ in IELTS Writing Task 1 requires a clear understanding of the task, effective data interpretation, and proficient use of the English language. Happy studying and best of luck in your IELTS preparation!