The rising cost of living in major cities is a hot topic in today’s world, making “housing affordability” a recurring theme in IELTS Writing Task 1. This essay will equip you with the skills to analyze and articulate trends related to housing affordability in major cities, drawing upon data from 2000 to 2023. We will delve into potential IELTS questions, dissect relevant data, and craft a band-scoring essay.
Sample IELTS Writing Task 1 Questions
- The graph below shows the average house price to income ratio in three major cities from 2000 to 2020. Summarise the information by selecting and reporting the main features, and make comparisons where relevant.
- The table illustrates changes in housing affordability in five global cities between 2010 and 2020, measured by the percentage of median income required to service a mortgage on a median-priced home. Write a report for a university lecturer describing the main information.
- The chart below presents the percentage change in median house prices and median household income in London from 2000 to 2020. Summarise the information by selecting and reporting the main features, and make comparisons where relevant.
Data Visualization and Sample Essay
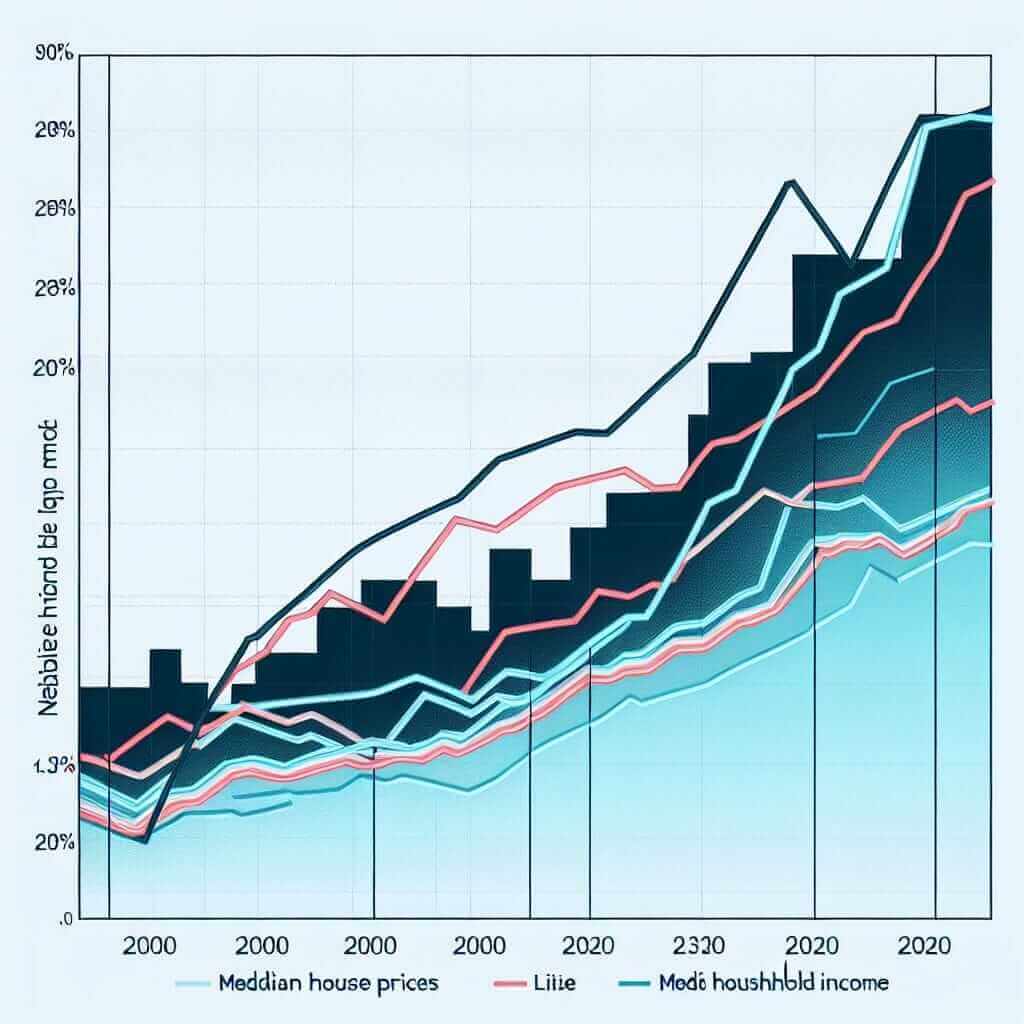
Let’s focus on question 3. Imagine you are given the following chart:

Analyzing the Task
This task presents a line graph, a common format for IELTS Writing Task 1. You are expected to:
- Paraphrase the information: Describe what the chart shows in your own words.
- Highlight key trends: Identify the most significant changes and patterns.
- Make comparisons: Discuss any notable differences or similarities in the data.
- Use accurate data: Support your statements with figures from the chart.
Model Essay
The line graph illustrates the percentage change in both median house prices and median household income in London over a two-decade period, from 2000 to 2020.
Overall, the graph reveals a concerning trend of diminishing housing affordability in London. While both house prices and household incomes experienced growth, the former significantly outpaced the latter.
At the start of the millennium, median house prices in London were approximately 50% higher than in 2000. This upward trajectory continued, albeit with some fluctuations, reaching a peak of nearly 200% by 2020. In contrast, median household income exhibited a much slower growth rate. Starting from the same baseline in 2000, incomes saw a modest increase to around 30% above the base year by 2010. However, this growth remained relatively stagnant thereafter, reaching just above 40% by the end of the period.
This disparity between soaring house prices and lagging income growth underscores the escalating challenge of housing affordability in London. The data suggests that for many Londoners, owning a home has become increasingly difficult over the past two decades.
(Word count: 175 words)
Key Considerations for Writing
- Paraphrasing: Avoid simply copying the language in the task. Use synonyms and rephrasing to demonstrate your vocabulary range (e.g., “illustrates” instead of “shows,” “diminishing housing affordability” instead of “housing affordability decreasing”).
- Trend Language: Use appropriate vocabulary to describe trends like “increase,” “decrease,” “fluctuate,” “peak,” “plateau,” etc.
- Data Specificity: Be precise when citing figures. Use words like “approximately,” “nearly,” “just above” to reflect the accuracy of the data.
- Concise Language: Focus on conveying the key information clearly and efficiently within the word limit.
Essential Vocabulary
- Affordability (noun /əˌfɔːrdəˈbɪləti/): The state of being affordable.
- Median (adjective /ˈmiːdiən/): Denoting the middle value in a distribution.
- Disparity (noun /dɪˈspærəti/): A great difference.
- Trajectory (noun /trəˈdʒektəri/): A path or curve that shows the movement of an object.
- Stagnant (adjective /ˈstæɡnənt/): Not flowing or moving, and often smelling unpleasant.
Conclusion
Mastering IELTS Writing Task 1 requires a blend of analytical and linguistic skills. By understanding data trends, utilizing appropriate vocabulary, and structuring your response effectively, you can confidently approach tasks related to housing affordability and other socioeconomic themes. Remember to practice regularly and familiarize yourself with diverse data representation formats to achieve your desired band score.