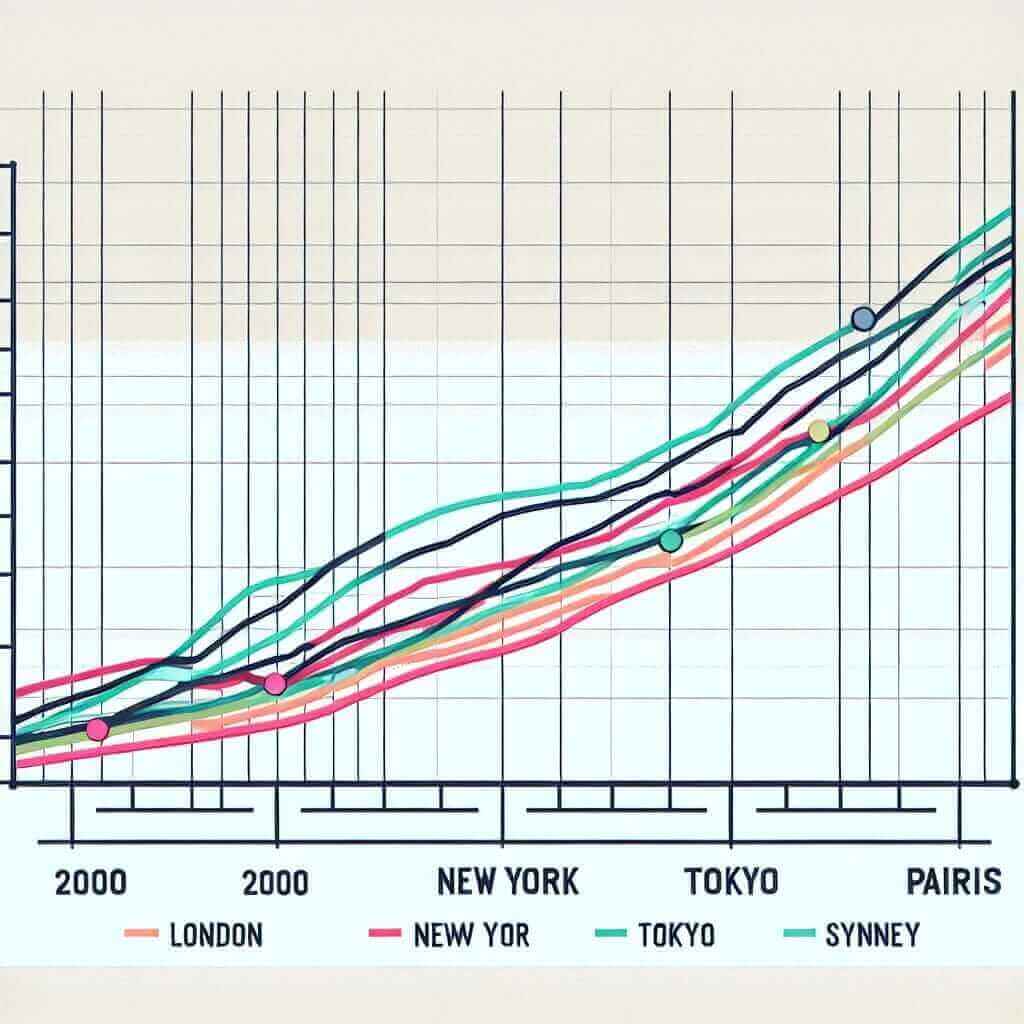
In the IELTS Writing Task 1, candidates are often asked to describe and interpret data represented in graphs, tables, and charts. One of the recurring themes in IELTS is housing prices in major cities over a period of time. Analyzing housing prices requires a specific set of vocabulary, grammatical structures, and analytical skills. In this article, we will delve into the topic of “Housing Prices in Major Cities (2000-2023)” and provide a comprehensive guide to tackling these types of questions effectively.
Understanding the Task
Sample Task 1 Questions on Housing Prices
-
The graph below shows the average housing prices in five major cities from 2000 to 2023. Summarize the information by selecting and reporting the main features, and make comparisons where relevant.
-
The table below gives information about the housing prices in three major cities from 2000 to 2023. Summarize the information by selecting and reporting the main features, and make comparisons where relevant.
-
The chart below compares the trends in housing prices in major cities from 2000 to 2023. Summarize the information by selecting and reporting the main features, and make comparisons where relevant.
Choosing a Sample Task
Let’s choose the first task for our detailed analysis and writing sample:
“The graph below shows the average housing prices in five major cities from 2000 to 2023. Summarize the information by selecting and reporting the main features, and make comparisons where relevant.”
Data Representation
To create a realistic scenario, we will generate a hypothetical line graph showing the trends in average housing prices for five major cities: London, New York, Tokyo, Sydney, and Paris.
| Year | London | New York | Tokyo | Sydney | Paris |
|------|--------|----------|-------|--------|-------|
| 2000 | 300k   | 270k     | 240k  | 220k   | 250k  |
| 2005 | 340k   | 310k     | 280k  | 260k   | 290k  |
| 2010 | 380k   | 350k     | 320k  | 300k   | 330k  |
| 2015 | 420k   | 390k     | 360k  | 340k   | 370k  |
| 2020 | 460k   | 430k     | 400k  | 380k   | 410k  |
| 2023 | 500k   | 470k     | 440k  | 420k   | 450k  |
Task Analysis
This task requires you to:
- Identify main trends in housing prices over the period.
- Compare and contrast the data across different cities.
- Highlight significant changes and patterns.
Writing Sample
Sample IELTS Writing Task 1 Essay:
The line graph illustrates the average housing prices in five major cities – London, New York, Tokyo, Sydney, and Paris – from 2000 to 2023.
Overall, it is evident that housing prices in all five cities experienced a continuous upward trend over the 23-year period. Among these cities, London consistently had the highest housing prices, while Sydney started as the city with the lowest prices but saw significant growth.
In 2000, the housing prices in London stood at $300,000, making it the priciest city among the five. New York and Paris followed with prices at $270,000 and $250,000 respectively. Tokyo and Sydney had the lowest prices, at $240,000 and $220,000 each.
By 2023, housing prices in London had soared to $500,000, maintaining its position as the most expensive city. New York saw a similar increase, reaching $470,000. The housing market in Sydney rose dramatically, with prices doubling to $420,000, reflecting the most significant rise. Meanwhile, Tokyo and Paris housing prices reached $440,000 and $450,000 respectively.
Additionally, the data indicates that the increase in housing prices was relatively more gradual in Tokyo and Paris compared to the steep rise observed in Sydney and New York.
Word Count: 191
Key Points to Remember When Writing
- Tense Usage: Use the past simple tense to describe completed actions and present perfect tense to highlight ongoing trends.
- Comparative Language: Utilize comparative and superlative structures to compare housing prices across different cities.
- Specific Vocabulary: Terms such as “trend,” “rise,” “fall,” “fluctuate,” “peak,” and “bottom out” are crucial for describing data trends.
Useful Vocabulary
- Fluctuate (verb) /ˈflʌktʃueɪt/: To change frequently from one level to another.
- Surge (noun) /sɜːrdʒ/: A sudden and great increase.
- Soar (verb) /sɔːr/: To rise very quickly to a high level.
- Dip (verb) /dɪp/: To go down to a lower level.
- Spike (noun) /spaɪk/: A sudden increase in something.
Conclusion
Successfully handling IELTS Writing Task 1 involving housing prices requires a sharp eye for detail and the ability to present data clearly and concisely. By mastering the relevant vocabulary and grammatical structures, and by practicing with similar data sets, you can enhance your ability to score a Band 7+ in this section.