Data analysis is a crucial skill for success in IELTS Writing Task 1. This comprehensive guide will walk you through the essential steps to effectively analyze and interpret various types of data, helping you achieve a higher band score in this challenging section of the IELTS exam.
Understanding the Importance of Data Analysis in IELTS Writing Task 1
Before diving into the specifics, it’s essential to recognize why data analysis is so critical for IELTS Writing Task 1. This task requires you to describe, summarize, and compare information presented in graphs, charts, tables, or diagrams. Your ability to accurately interpret and explain the data will directly impact your score.
How to analyze IELTS writing task 1 data? is a question many test-takers grapple with, but mastering this skill can significantly boost your performance.
Step-by-Step Guide to Analyzing Data for IELTS Writing Task 1
1. Identify the Type of Data Presentation
The first step in analyzing data is to correctly identify the type of visual representation you’re dealing with. Common types include:
- Line graphs
- Bar charts
- Pie charts
- Tables
- Diagrams or processes
Each type requires a slightly different approach to analysis and description.
2. Understand the Overall Purpose
Before delving into specific details, take a moment to grasp the overall purpose of the data. Ask yourself:
- What is the main topic or theme?
- What time period is covered (if applicable)?
- What units of measurement are used?
This overview will help you structure your response more effectively.
3. Identify Key Features and Trends
Once you’ve grasped the overall picture, focus on identifying the most significant features and trends in the data. Look for:
- Highest and lowest values
- Notable increases or decreases
- Patterns or cycles
- Anomalies or exceptions
Remember, your task is not to describe every single detail but to highlight the most important aspects of the data.
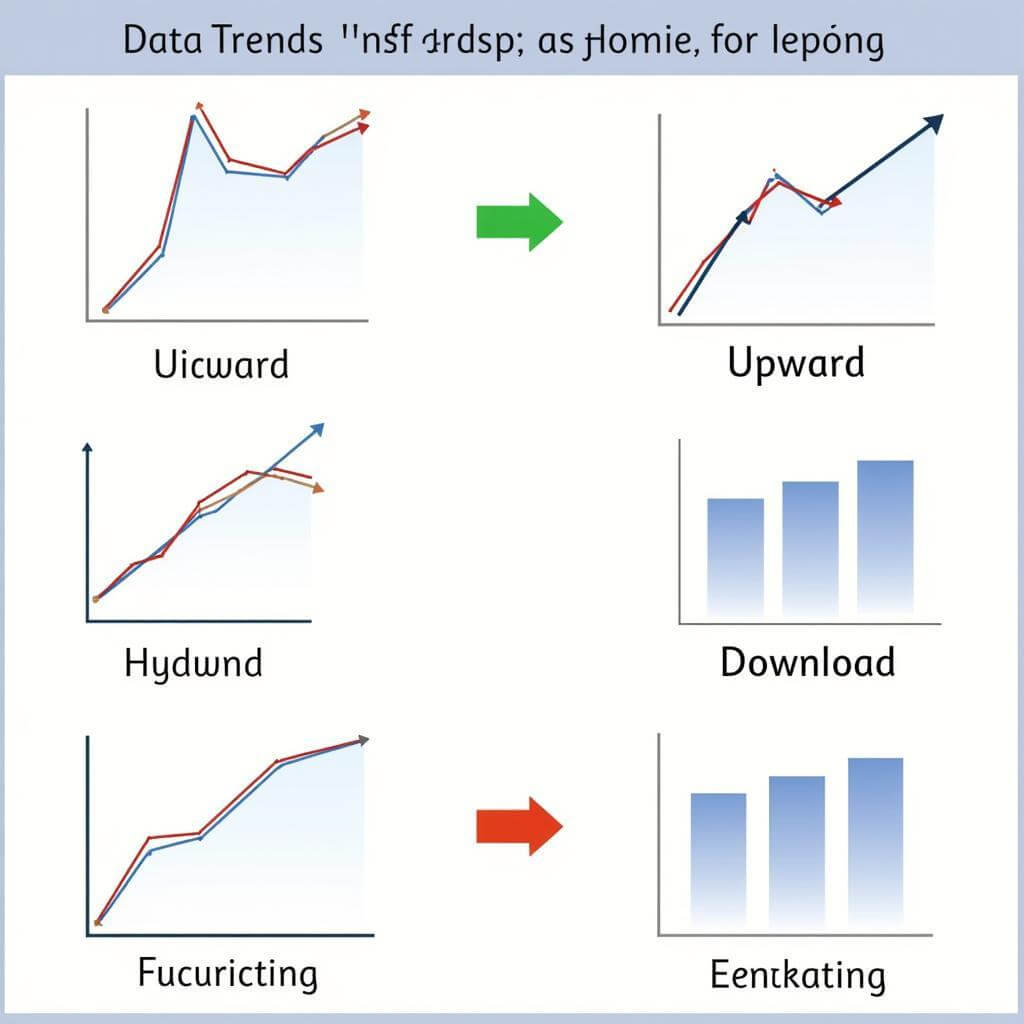
 Analyzing trends in IELTS Writing Task 1 data
4. Compare and Contrast
Many IELTS Writing Task 1 questions require you to compare different sets of data. When doing so:
- Look for similarities and differences between categories or time periods
- Identify any correlations or relationships between different variables
- Use appropriate comparative language to express these relationships
5. Quantify Your Observations
Whenever possible, support your analysis with specific figures from the data. However, be selective and focus on the most significant numbers. As IELTS expert Dr. Jane Smith advises:
“Don’t overwhelm your reader with too many figures. Choose the most impactful numbers that best illustrate your key points.”
6. Recognize Patterns and Exceptions
Look for overall patterns in the data, but also be aware of any exceptions or anomalies. These can often be the most interesting aspects to discuss in your analysis.
Advanced Techniques for Data Analysis
Once you’ve mastered the basics, consider these advanced techniques to elevate your data analysis skills:
1. Grouping Similar Data
When faced with complex data sets, try grouping similar information together. This can help you identify broader trends and make your analysis more coherent.
2. Calculating Percentages
For some types of data, calculating percentages can provide valuable insights. This is particularly useful when comparing different categories or time periods.
3. Identifying Correlations
Look for potential relationships between different variables in the data. While you shouldn’t speculate on causes, noting correlations can demonstrate a deeper level of analysis.
 Identifying correlations in IELTS Writing Task 1 data
Common Pitfalls to Avoid
When analyzing data for IELTS Writing Task 1, be careful to avoid these common mistakes:
- Over-describing: Don’t try to mention every single data point. Focus on the most significant aspects.
- Speculation: Stick to the facts presented in the data. Avoid making assumptions or giving opinions.
- Repetition: Vary your language when describing similar trends or features.
- Inaccuracy: Double-check your interpretations to ensure they accurately reflect the data.
How to organize data in IELTS writing task 1 reports can help you avoid these pitfalls and structure your response effectively.
Practicing Data Analysis for IELTS Success
Improving your data analysis skills requires consistent practice. Here are some effective strategies:
- Analyze real-world data: Look for graphs and charts in newspapers, magazines, or academic journals and practice describing them.
- Time yourself: Practice analyzing data within the time constraints of the actual exam.
- Seek feedback: Have a teacher or study partner review your analyses to identify areas for improvement.
- Review sample answers: Study high-scoring IELTS Writing Task 1 responses to understand what examiners are looking for.
Remember, as experienced IELTS tutor Mark Johnson says:
“The key to mastering data analysis for IELTS Writing Task 1 is practice, practice, and more practice. The more diverse the data sets you encounter, the better prepared you’ll be for the exam.”
Conclusion
Analyzing data for IELTS Writing Task 1 is a skill that can be developed with practice and the right approach. By following this comprehensive guide and consistently applying these techniques, you’ll be well-equipped to tackle any data set you encounter in your IELTS exam. Remember to stay focused on the key features, use precise language, and practice regularly to improve your performance.
How to handle unfamiliar task 1 topics can provide additional strategies for approaching challenging data sets with confidence.
FAQs
-
How much time should I spend analyzing the data before writing?
Aim to spend about 3-5 minutes analyzing the data before you start writing. This will help you organize your thoughts and identify key points to discuss. -
Should I mention every number in the data set?
No, focus on the most significant figures that illustrate your main points. Overloading your response with numbers can make it difficult to read and understand. -
What if I don’t understand some of the data?
Stay calm and focus on the parts you do understand. It’s better to write accurately about less information than to guess and potentially make mistakes. -
How can I improve my speed in analyzing data?
Regular practice is key. Try timing yourself while analyzing different types of charts and graphs to build speed and confidence. -
Is it necessary to use complex vocabulary when describing data?
While using appropriate academic vocabulary is important, clarity is paramount. Use complex terms only if you’re confident in their meaning and relevance to the data. -
Can I give my opinion on the data in IELTS Writing Task 1?
No, IELTS Writing Task 1 requires objective description and analysis of the data presented. Save your opinions for Task 2.


