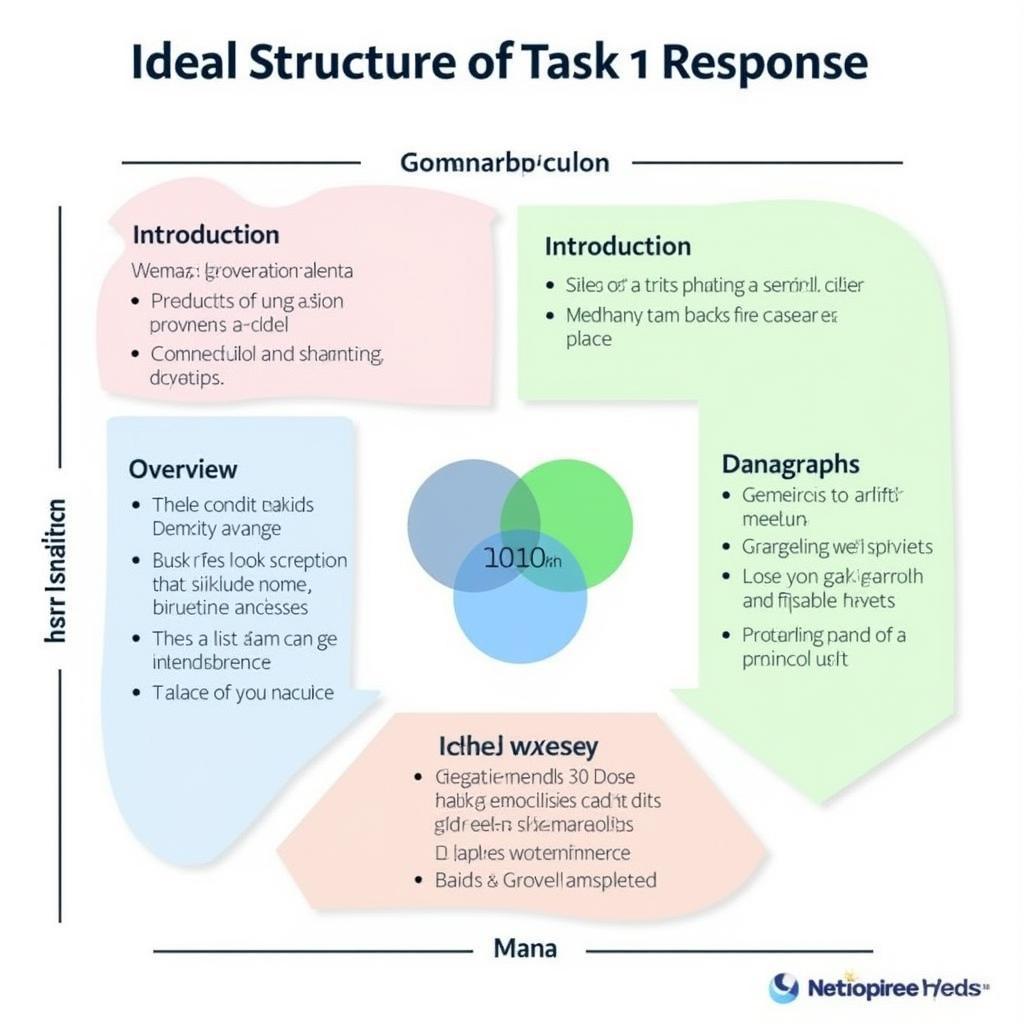
Understanding how to interpret and describe tables in IELTS Writing Task 1 is crucial for achieving a high band score. This comprehensive guide will walk you through proven strategies to effectively analyze and present tabular data in your response.
Understanding the Basics of Table Analysis
The first step in mastering table analysis is developing strong data interpretation skills. improving understanding of factual information is essential for accurately presenting numerical data and identifying key trends.
Key Components to Identify
- Time periods or categories
- Units of measurement
- Main trends and patterns
- Significant figures
- Notable comparisons
Developing a Strong Overview
Before diving into details, crafting a clear overview paragraph is vital. As noted by Dr. Sarah Richardson, IELTS examiner with 15 years of experience: “A well-written overview acts as a roadmap for your entire response, highlighting the most significant features of the data.”
how to analyze data for IELTS writing task 1 provides valuable insights into developing effective overview statements.
Essential Elements of an Overview
- Main trends
- Overall patterns
- Significant changes
- Notable relationships between data sets
Organizing Your Response
Paragraph Structure
- Introduction
- Overview
- Detailed analysis (2-3 paragraphs)
- No conclusion needed

Advanced Data Analysis Techniques
how to handle complex task 1 data is crucial when dealing with more complicated tables. Consider these strategies:
Comparing and Contrasting
- Identify highest and lowest values
- Look for significant differences
- Note patterns and exceptions
- Compare related categories
Data Selection
Professor James Thompson, IELTS preparation expert, emphasizes: “Focus on selecting key data points that best illustrate the main trends rather than attempting to describe every number.”
Common Pitfalls to Avoid
avoiding common mistakes in task 1 highlights several crucial points:
- Don’t include personal opinions
- Avoid irrelevant information
- Don’t speculate about causes
- Don’t copy numbers without analysis
- Avoid overcomplicating simple data
Effective Language Use
Key Language Features
- Comparison language
- Trend vocabulary
- Numerical expressions
- Linking devices
improving scanning for specific details can help you quickly identify key data points for description.
Practice Strategies
Effective Practice Methods
- Time yourself (20 minutes)
- Use real past exam questions
- Compare your answers with model responses
- Practice identifying key features quickly
- Review and learn from mistakes
FAQ Section
Q: How long should my table description be?
A: Aim for 150-170 words to ensure adequate coverage while meeting the minimum requirement.
Q: Should I mention every number in the table?
A: No, focus on significant figures that illustrate main trends and patterns.
Q: How do I choose which information to include?
A: Select data that best supports your overview and demonstrates key trends or significant changes.
Q: Is it necessary to write a conclusion?
A: No, Task 1 responses don’t require conclusions. Focus on thorough analysis instead.
Q: How should I handle tables with multiple categories?
A: Group related information and discuss patterns within and between categories logically.