Mastering Trend Description for IELTS Success
In the IELTS Writing Task 1 (Academic), you’ll often encounter charts, graphs, or diagrams illustrating trends over time. Describing these trends accurately and effectively is key to achieving a high band score. This guide, crafted by an experienced IELTS instructor with over two decades of experience, will equip you with the essential skills to analyze and articulate trends like a pro.
Understanding Trends: The Heart of Data Interpretation
Before diving into the “how-to,” let’s clarify what we mean by “trends.” Trends represent patterns of change in data over a specified period. They can be:
- Upward: Indicating an increase (e.g., production rose).
- Downward: Showing a decrease (e.g., unemployment fell).
- Stable: Demonstrating little to no change (e.g., prices remained stable).
- Fluctuating: Exhibiting irregular ups and downs (e.g., sales fluctuated throughout the year).
Describing Trends with Precision
1. Employing Precise Vocabulary:
The words and phrases you choose significantly impact the clarity of your description. Here’s a breakdown:
For Upward Trends:
- Verbs: Increase, rise, grow, climb, soar, surge, escalate, improve
- Nouns: An increase, a rise, growth, an upward trend, an upswing
- Adverbs: Sharply, rapidly, considerably, significantly, steadily, gradually
For Downward Trends:
- Verbs: Decrease, decline, fall, drop, reduce, plummet, dwindle
- Nouns: A decrease, a decline, a fall, a drop, a reduction, a downward trend, a downswing
- Adverbs: Sharply, rapidly, considerably, significantly, steadily, gradually
For Stable Trends:
- Verbs: Remain stable, stay constant, stabilize, level off
- Nouns: Stability, a plateau
- Adverbs: Relatively, comparatively
For Fluctuating Trends:
- Verbs: Fluctuate, vary, oscillate
- Nouns: Fluctuation, variation, oscillation
2. Using Prepositions for Time and Measurement:
Prepositions help specify the time frame and degree of change:
- Time: From…to, between…and, during, over, in
- Measurement: By, to, at, of
Example: “The price of oil rose by 10% between January and March.”
3. Illustrating with Data:
Always support your trend descriptions with specific data points from the graph or chart.
Example: “Sales increased dramatically, rising from 2,000 units in January to 5,000 units in June.“
Examining a Real IELTS Task
Let’s analyze an example:

Sample Description:
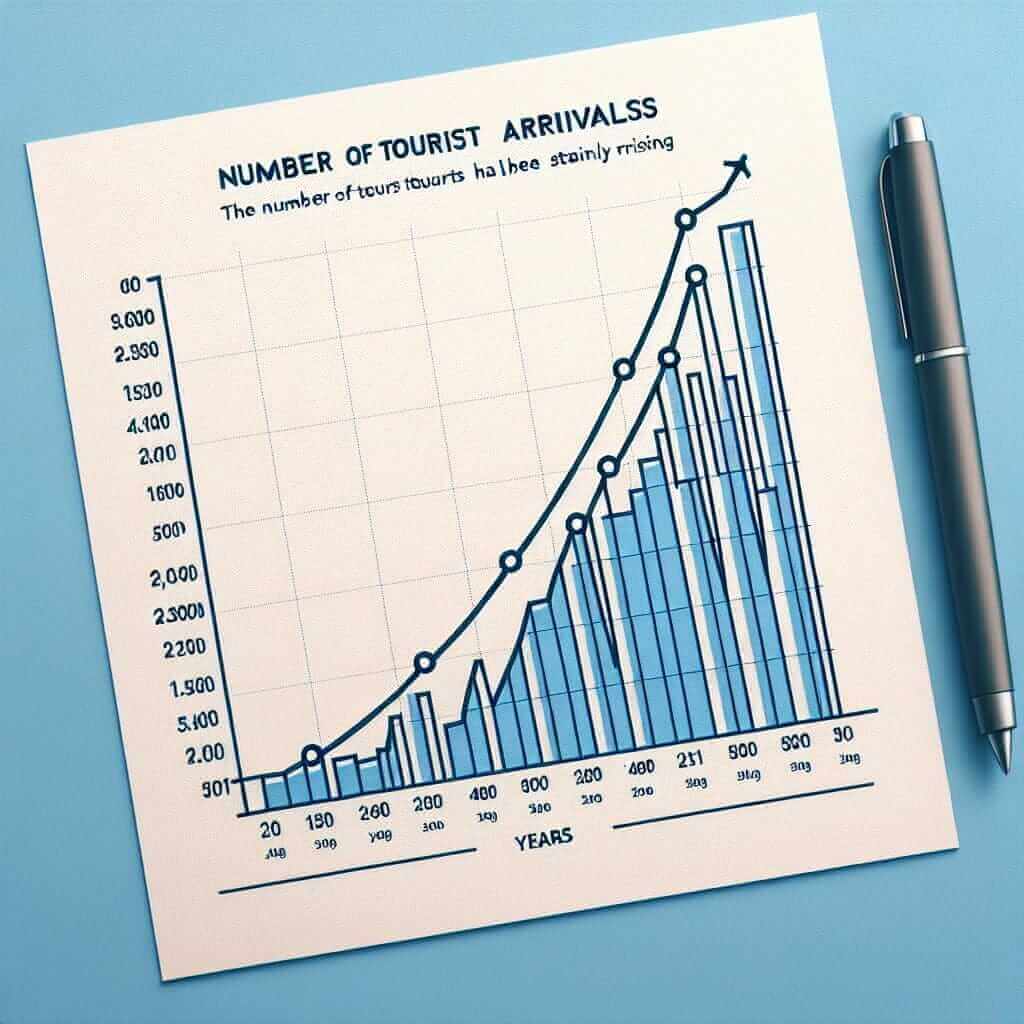
“The graph illustrates the changes in the number of tourists visiting a particular country between 1995 and 2010. Overall, there was a significant upward trend in tourist arrivals over the period shown. In 1995, the country welcomed approximately 1.5 million visitors. This number increased steadily, reaching 2.5 million by 2000. From 2000 to 2005, there was a more dramatic rise, with tourist numbers climbing to 4 million. Although there was a slight dip in 2006, the trend continued upward, and by 2010, the country received just over 5 million tourists.”
Tips for Success
- Analyze the Task Carefully: Before you begin writing, take a moment to understand what the graph or chart is showing.
- Use a Clear Structure: Organize your response logically, using paragraphs to separate different trends or time periods.
- Vary Your Language: Avoid repetition by using a range of vocabulary and grammatical structures.
- Proofread Thoroughly: Check your work for any errors in grammar, spelling, or punctuation.
Conclusion
Mastering the art of trend description is fundamental to excelling in the IELTS Writing Task 1. By understanding the different types of trends, using precise language, and supporting your claims with evidence from the data, you can confidently tackle this section of the exam. Remember, consistent practice is key. Analyze various charts, practice writing descriptions, and seek feedback to refine your skills. With dedication and the right strategies, you’ll be well on your way to achieving your desired IELTS score.