Introduction: Mastering IELTS Writing Task 1
The IELTS Writing test often feels daunting, especially Task 1. Many candidates struggle with describing graphs, charts, and diagrams effectively. However, with a clear understanding of the task requirements and a strategic approach, you can confidently tackle any visual data representation. This comprehensive guide will equip you with the skills and knowledge to excel in describing Writing Task 1, boosting your overall IELTS score.
Understanding the Task: What IELTS Expects
Before diving into techniques, let’s clarify what IELTS examiners look for:
- Task Achievement: Accurately understand and fully cover all aspects of the given visual information.
- Coherence and Cohesion: Present a well-organized response with clear connections between sentences and paragraphs.
- Lexical Resource: Demonstrate a wide range of vocabulary related to trends, comparisons, and data interpretation.
- Grammatical Range and Accuracy: Employ a variety of sentence structures accurately, with minimal grammatical errors.
Describing Writing Task 1: A Step-by-Step Approach
1. Analyze the Visual Information
- Identify the type of visual: Is it a line graph, bar chart, pie chart, table, process diagram, or map?
- Understand the axes and labels: What variables are being measured? What are the units of measurement?
- Determine the main trends, patterns, and key features: What are the most significant changes, comparisons, or trends depicted?
2. Plan Your Response: Structure is Key
- Introduction: Paraphrase the task question and state the type of visual information presented.
- Overview: Summarize the most important trends or features, highlighting key differences or similarities.
- Body Paragraphs: Divide the information into logical sections (usually 2-3 paragraphs). Focus on describing specific details, comparisons, and trends, supporting your statements with data from the visual.
- Conclusion (Optional): Briefly restate the main trends. However, do not introduce new information.
3. Use Effective Language for Data Description
Vocabulary for Describing Trends:
- Upward Trends: increase, rise, grow, climb, soar, surge, peak
- Downward Trends: decrease, decline, fall, drop, plummet, reduce
- Fluctuations: fluctuate, vary, oscillate
- Stability: remain stable, stay constant, level off
Vocabulary for Making Comparisons:
- Comparatives and Superlatives: higher than, the highest, lower than, the lowest
- Other Useful Phrases: in contrast to, compared with, similarly, while, whereas
Expressing Approximation:
- approximately, roughly, nearly, around, just over, just under
4. Examples from Real IELTS Tests
Example 1: Line Graph
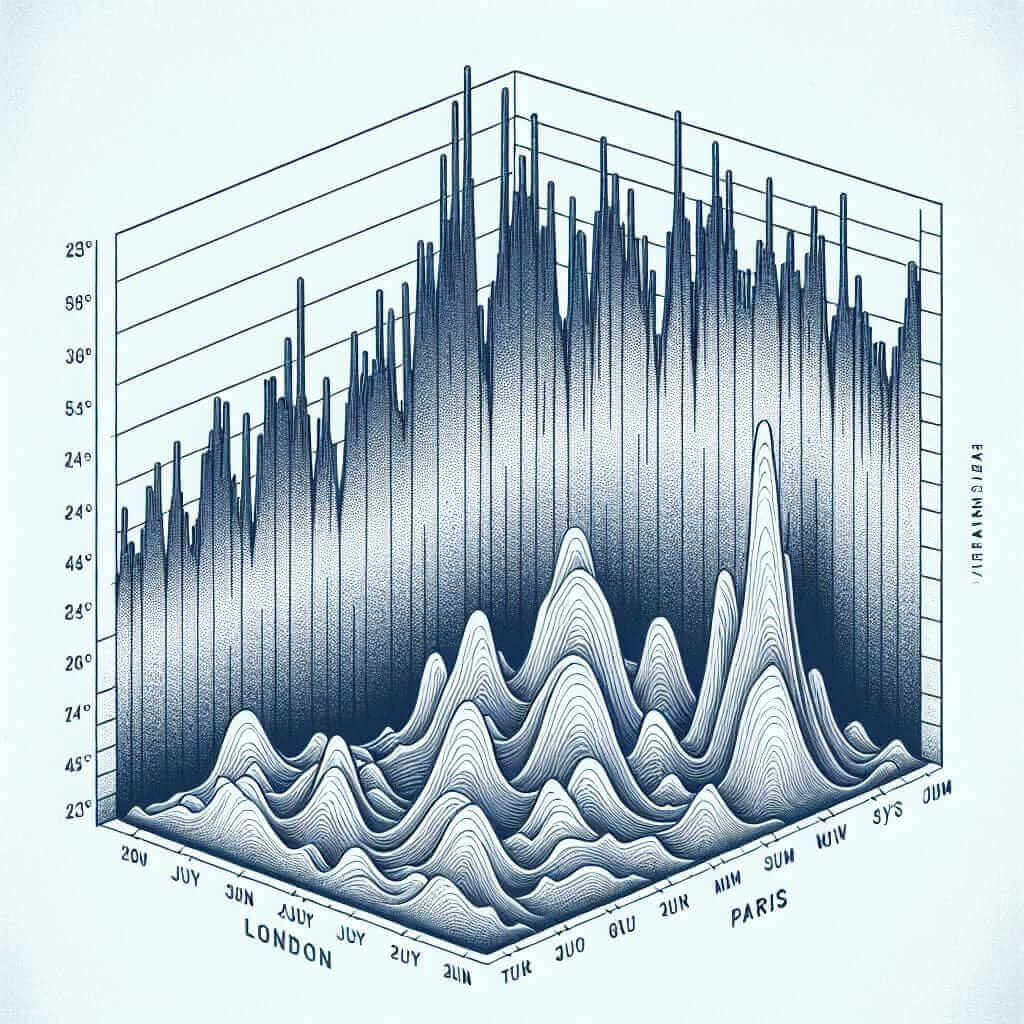
- The line graph illustrates the average monthly temperatures in London and Paris.
- Key Features:
- London experiences a wider temperature range than Paris.
- July is the hottest month in both cities.
- Paris generally has milder winters than London.
Example 2: Bar Chart
- The bar chart compares the percentage of people using different modes of transportation in two cities.
- Key Features:
- Car use is significantly higher in City A.
- City B has a much higher proportion of people using public transport.

5. Tips for Success
- Paraphrase: Don’t copy directly from the task question.
- Be Concise: Avoid unnecessary details or repetition.
- Support with Data: Use specific figures and data points from the visual.
- Proofread Carefully: Check for grammar and spelling errors.
Conclusion
Mastering IELTS Writing Task 1 requires practice and a focused approach. By understanding the task requirements, planning your response strategically, and employing effective language, you can confidently analyze and describe visual data. Remember to familiarize yourself with different types of visuals and practice using a variety of vocabulary for describing trends and comparisons. With dedicated effort, you can achieve your desired IELTS score!