As an IELTS instructor with over two decades of experience, I understand the importance of confidently analyzing graphs in the IELTS Writing Task 1. A key skill for success is the ability to accurately identify and describe general trends. This article provides a comprehensive guide on how to master this essential skill.
Understanding General Trends in IELTS Graphs
A “general trend” refers to the overall pattern or direction of data points in a graph over a given period. It’s not about focusing on minor fluctuations, but rather capturing the big picture. Identifying trends allows you to demonstrate your understanding of the data and its significance.
Steps to Identify and Describe General Trends
1. Analyze the Axes and Title
Before diving into the data, carefully examine the graph’s title, axes labels, and units of measurement. This provides crucial context for understanding the information presented.
2. Look for Overall Patterns
Instead of getting lost in individual data points, step back and observe the overall movement of the graph. Is the data generally increasing, decreasing, fluctuating, or remaining stable over time?
3. Identify Key Features
- Trends: Describe the direction of the trend (upward, downward, stable) and use appropriate adjectives like significant, gradual, sharp, steady, fluctuating.
- Turning points: Highlight any major shifts or turning points in the trend.
- Peaks and troughs: Point out any significant highs and lows on the graph.
4. Use Precise Language
Employing accurate vocabulary is essential for effectively describing trends. Here are some useful verbs, adverbs, and phrases:
Verbs: rise, increase, grow, climb, surge, peak, fall, decline, decrease, drop, dip, fluctuate, level off, remain stable, stay constant
Adverbs: sharply, dramatically, rapidly, significantly, steadily, gradually, slightly, slowly
Phrases: a sharp increase, a gradual decline, an upward trend, a downward trend, a peak of, a low of, remained stable at

Illustrative Example from IELTS Writing Task 1
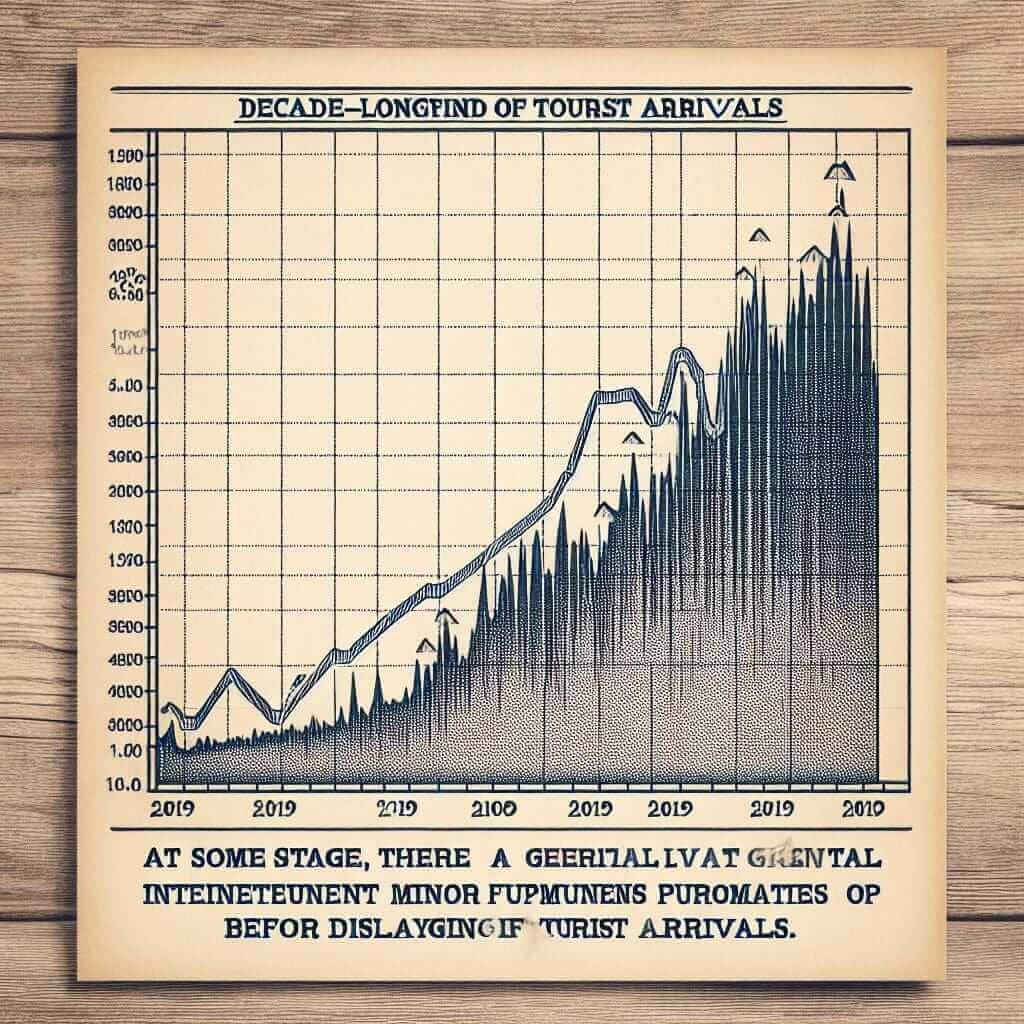
Let’s consider an example of a line graph showing the number of tourists visiting a particular country over a 10-year period.
Instead of writing: “The number of tourists went up and down a lot.”
You could write: “The number of tourists visiting the country demonstrated an overall upward trend between 2010 and 2020, despite some fluctuations. After a sharp increase in 2013, numbers plateaued for a couple of years before rising again steadily until 2019.”
Tips for Success
- Practice Regularly: Familiarize yourself with various graph types (line graphs, bar charts, pie charts) and practice identifying trends.
- Use a Variety of Language: Avoid repetition by utilizing a range of vocabulary to describe different types of trends.
- Focus on Clarity and Concision: Present your analysis in a clear and concise manner, avoiding unnecessary details.
- Proofread Carefully: Ensure your writing is free from grammatical and spelling errors.
By mastering the art of identifying and describing general trends in graphs, you’ll significantly enhance your ability to excel in the IELTS Writing Task 1. Remember to practice consistently, use precise language, and focus on conveying the key insights from the data. Good luck!