IELTS Writing Task 1 can be daunting, especially when faced with complex data sets. This guide will equip you with effective strategies to handle intricate charts, graphs, and tables confidently. By mastering these techniques, you’ll be well-prepared to tackle even the most challenging Task 1 questions.
Understanding Complex Data in IELTS Task 1
Complex data in IELTS Task 1 often involves multiple variables, intricate relationships, or a combination of different chart types. The key to success lies in your ability to analyze and interpret this information accurately.
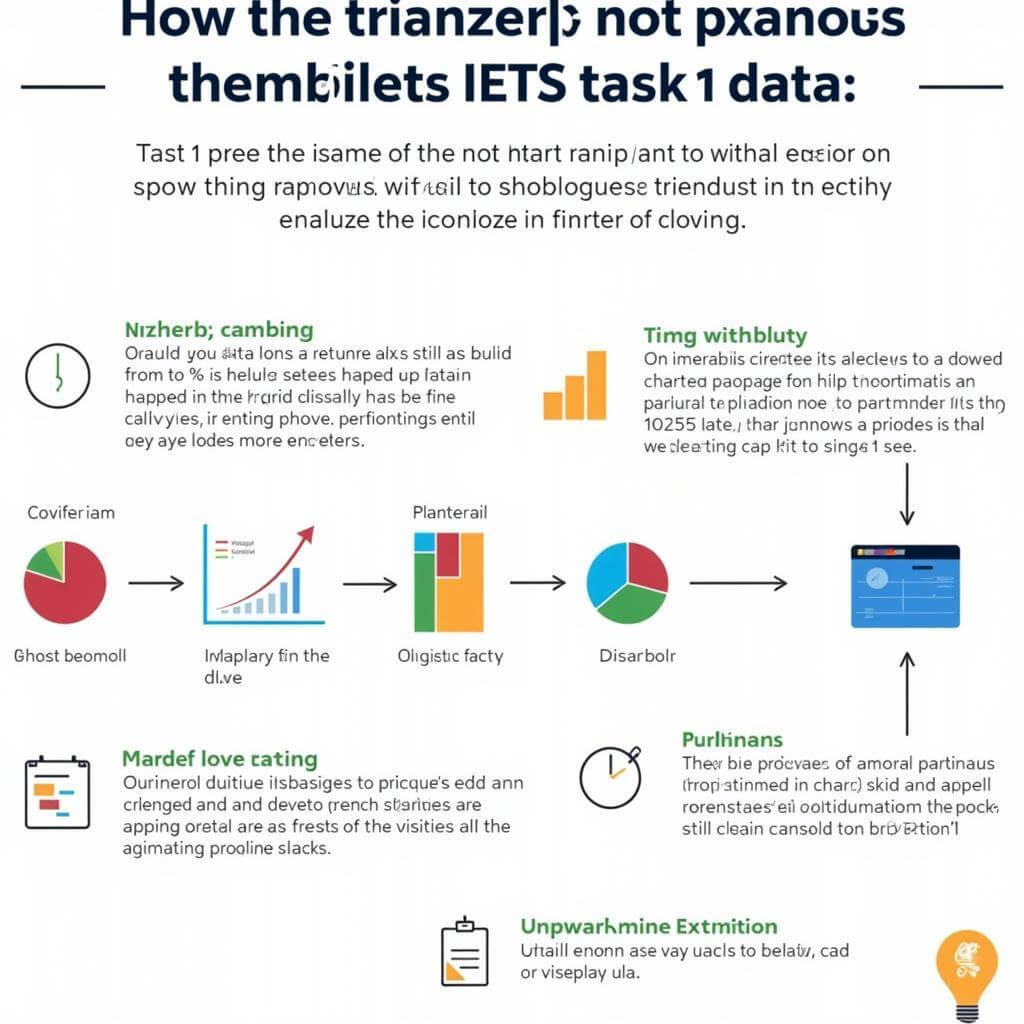
Types of Complex Data You May Encounter
- Multiple line graphs
- Combination of bar charts and line graphs
- Complex pie charts with numerous segments
- Tables with multiple rows and columns
- Process diagrams with multiple stages
How to analyze data for IELTS writing task 1 is crucial for tackling these challenging questions effectively.
Strategies for Approaching Complex Task 1 Data
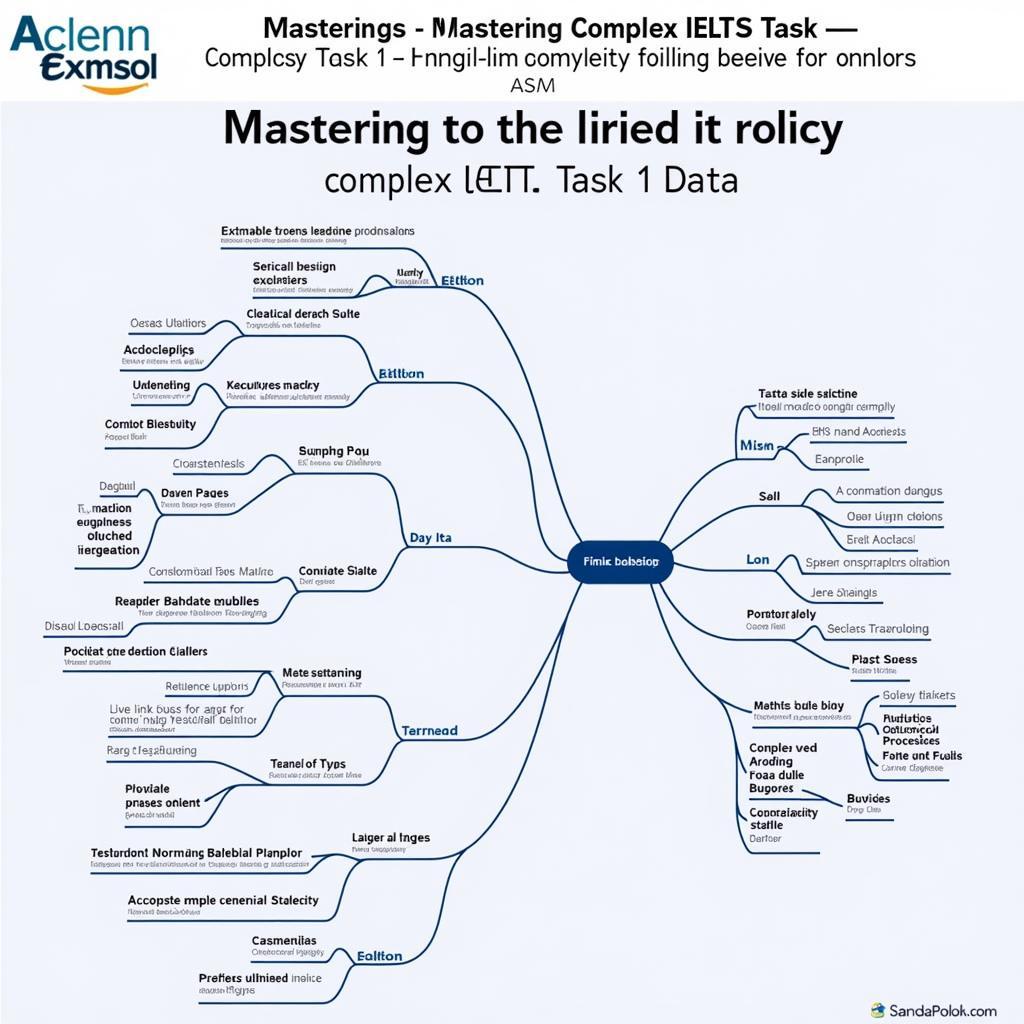
1. Identify the Big Picture
Before diving into details, take a moment to understand the overall trend or main message of the data. This will help you structure your response coherently.
2. Break Down the Information
Divide the data into manageable chunks. Focus on one aspect at a time, such as:
- Main trends
- Significant comparisons
- Notable exceptions or outliers
3. Prioritize Key Information
With complex data, it’s impossible to describe every detail. Identify the most important points that best represent the overall picture.
4. Use Clear Language and Transitions
Employ a variety of linking words and phrases to guide the reader through your description. This helps maintain clarity when discussing multiple data points.
 IELTS Task 1 Complex Data Analysis
Techniques for Handling Specific Types of Complex Data
Multiple Line Graphs
- Identify overall trends for all lines
- Compare and contrast the lines
- Highlight significant intersections or divergences
Combination Charts
- Describe each chart type separately
- Explain the relationship between different chart elements
- Identify any correlations or contrasts between the data sets
Complex Pie Charts
- Group similar segments together
- Focus on the largest and smallest segments
- Compare proportions rather than exact percentages
Data-Heavy Tables
- Identify patterns in rows or columns
- Highlight the highest and lowest values
- Calculate and describe percentage changes where relevant
How to handle unfamiliar task 1 topics can be particularly useful when faced with unusual data presentations.
Language Tips for Describing Complex Data
Using appropriate language is crucial when handling complex Task 1 data. Here are some tips to enhance your writing:
Use a Range of Comparison Language
- “In contrast to…”
- “While X showed an increase, Y experienced a decline…”
- “The difference between A and B was particularly pronounced in…”
Employ Precise Vocabulary for Trends
- “Fluctuated wildly”
- “Plateaued before rising sharply”
- “Experienced a gradual decline followed by a sudden spike”
Utilize Approximations When Appropriate
- “Approximately”
- “Roughly”
- “In the region of”
Mastering past tenses for task 1 is essential for accurately describing historical data and trends.
Common Pitfalls to Avoid
- Overcomplicating your description
- Trying to include every single data point
- Neglecting to provide an overview
- Misinterpreting the scale or units
- Failing to group related information
Dr. Emily Thompson, a renowned IELTS examiner, advises: “When faced with complex data, focus on telling a coherent story. Your goal is to guide the reader through the most significant aspects of the information presented.”
Practice Techniques for Improving Your Skills
- Timed practice: Set a 20-minute timer and attempt to describe complex charts fully
- Comparison exercises: Practice comparing different data sets side by side
- Summarization drills: Try to summarize complex data in just 2-3 sentences
- Peer review: Exchange your Task 1 responses with classmates for feedback
How to improve critical thinking for IELTS writing task 2 can also be applied to Task 1, helping you analyze complex data more effectively.
Structuring Your Response to Complex Data
- Introduction: Provide a clear overview of the data presented
- Body Paragraph 1: Describe the main trends or most significant features
- Body Paragraph 2: Discuss secondary trends or notable exceptions
- Body Paragraph 3 (if needed): Address any additional important aspects
- Conclusion: Summarize the key points without introducing new information
Remember, structure is crucial when dealing with complex data. A well-organized response will impress the examiner and ensure you cover all necessary points.
Enhancing Your Task 1 Performance
To truly excel in handling complex Task 1 data, consider these advanced tips:
- Practice data interpretation outside of IELTS contexts
- Study real-world reports and analyses to understand how experts describe complex information
- Develop a “data vocabulary” specific to different chart types and trends
- Learn to quickly identify the “story” behind the numbers
How to practice grammar for task 1 is essential for expressing complex ideas clearly and accurately.
IELTS expert Dr. Michael Chen states: “The key to mastering complex Task 1 data is practice and exposure. The more varied data sets you encounter, the more confident and skilled you’ll become in analyzing and describing them.”
 IELTS Task 1 Complex Data Mastery
Conclusion
Handling complex Task 1 data in IELTS Writing doesn’t have to be intimidating. By applying these strategies, practicing regularly, and focusing on clear, concise communication, you can approach even the most challenging questions with confidence. Remember, the goal is to demonstrate your ability to interpret and describe information accurately and coherently. With dedication and the right techniques, you’ll be well-equipped to excel in this crucial part of the IELTS Writing test.
FAQ
How long should I spend analyzing the data before writing?
Aim to spend about 3-5 minutes analyzing the data. This allows you to grasp the main trends without eating into your writing time.
What if I can’t understand all aspects of the complex data?
Focus on the parts you do understand and describe them in detail. It’s better to accurately describe some aspects than to misinterpret the entire data set.
Should I mention every number or percentage in the data?
No, select key figures that illustrate your main points. Over-reliance on numbers can make your response difficult to read.
How can I improve my speed in interpreting complex data?
Regular practice with varied chart types and data sets will improve your speed and accuracy over time.
Is it okay to use estimates when describing complex data?
Yes, using approximations is often appropriate, especially when dealing with complex figures. Just be sure to indicate that you’re estimating.


