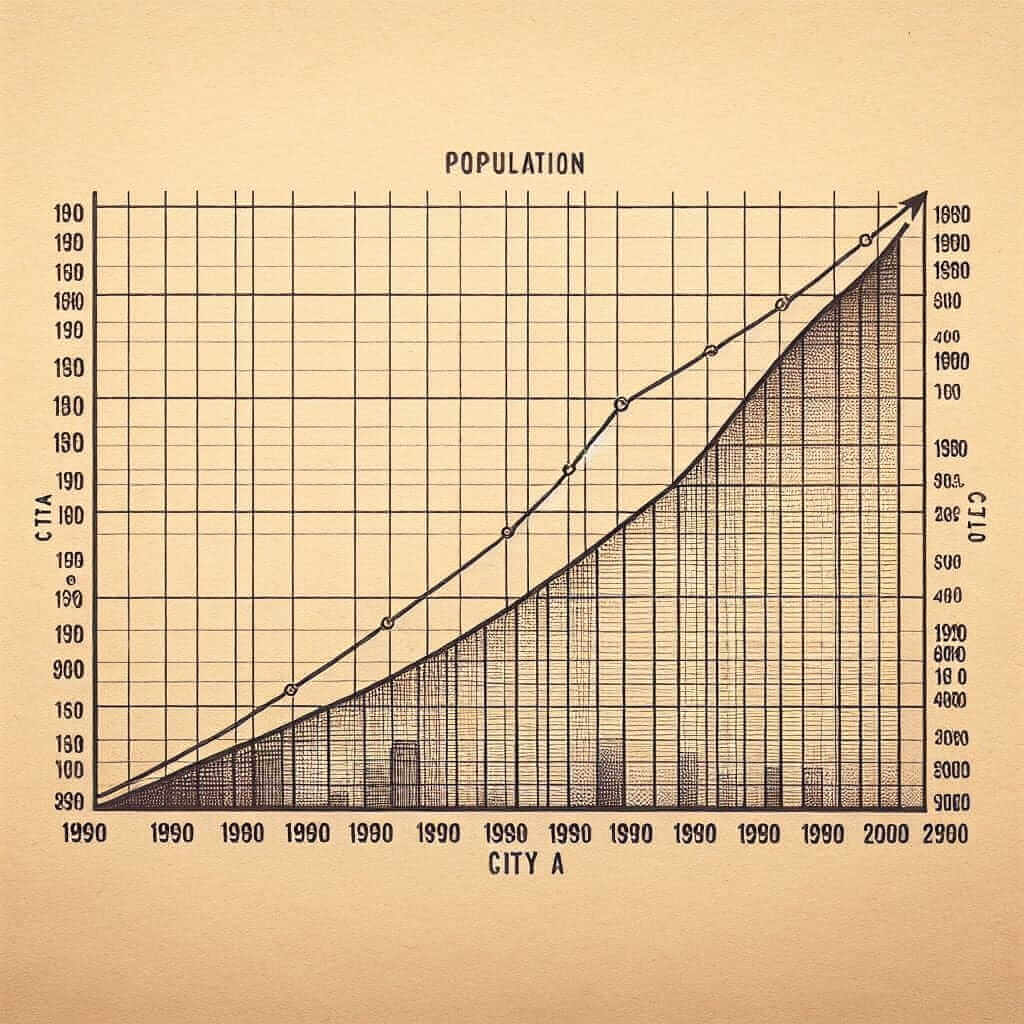
Mastering IELTS Academic Writing Task 1 is crucial for achieving a high band score. This section tests your ability to analyze and report on visual data, such as graphs, charts, diagrams, and maps. This comprehensive guide will provide you with actionable strategies and practical tips to significantly enhance your performance in this crucial area.
Understanding IELTS Academic Writing Task 1
In this task, you are presented with a visual representation of data and asked to describe the key features, trends, and comparisons in a minimum of 150 words. You have approximately 20 minutes to complete this task. The key is to demonstrate your ability to:
- Paraphrase the question: Rephrase the given instructions in your own words.
- Identify key features: Recognize the most significant information presented in the visual data.
- Compare and contrast: Highlight similarities, differences, and trends within the data.
- Use accurate grammar and vocabulary: Employ a wide range of grammatical structures and vocabulary specific to data analysis.
- Structure your response logically: Organize your writing with a clear introduction, body paragraphs, and conclusion.
Essential Tips for Improvement
1. Analyze the Visual Data Carefully
Before you start writing, spend a few minutes carefully examining the visual information provided. Pay attention to:
- Type of visual: Is it a line graph, bar chart, pie chart, table, map, process diagram, or a combination of several?
- Title and labels: Understand the context of the data being presented.
- Units of measurement: Note the units used (e.g., percentages, years, millions) for accurate reporting.
- Trends and patterns: Identify any noticeable increases, decreases, fluctuations, or significant points in the data.
Example: Consider a line graph showing the population growth of two cities over a period. Identify the starting and ending points for each city’s population, periods of rapid growth or decline, and any points where the populations intersect.

2. Structure Your Response Effectively
A well-structured response is crucial for clarity and coherence. Follow this general framework:
Introduction: Paraphrase the question and briefly describe the type of visual and its main purpose.
Example: “The line graph illustrates the changes in population figures for London and Paris from 1900 to 2000.”
Body Paragraphs: Each paragraph should focus on a specific trend or comparison. Use clear topic sentences and support your statements with relevant data from the visual.
Example: “From 1900 to 1950, London experienced a steady increase in population, rising from 5 million to 8 million. In contrast, Paris saw a slower growth rate during the same period…”
Conclusion: Summarize the key trends and findings without introducing new information.
Example: “In conclusion, while both cities experienced significant population growth, London’s population increased at a faster rate than Paris’s during the 20th century.”
3. Use a Variety of Grammatical Structures
Showcase your grammatical range by using:
- Complex sentences: Combine clauses effectively using conjunctions and connectors (e.g., while, although, however).
- Passive voice: Emphasize the action rather than the actor (e.g., “The population was recorded at…”).
- Prepositions: Describe positions and relationships within the data (e.g., at, in, by, to, from, between).
- Comparative and superlative adjectives: Highlight differences and similarities (e.g., higher, lower, the most significant).
Example: “Despite starting at a lower point, City A’s population surpassed that of City B in 2010.”
4. Enhance Your Vocabulary
Employ specific vocabulary related to describing trends, changes, and comparisons:
Trends: increase, decrease, rise, fall, climb, decline, fluctuate, remain stable, plateau, peak, reach a high/low point
Changes: gradual, steady, rapid, dramatic, significant, slight, minimal, noticeable
Comparisons: similarly, in contrast, however, while, whereas, on the other hand, compared to, in comparison with
Example: “The consumption of chocolate experienced a dramatic surge during the holiday season, while the demand for vegetables remained relatively stable.”
5. Practice Regularly with Authentic Materials
Consistent practice is key to improving your skills. Utilize past IELTS Academic Writing Task 1 questions and sample answers to familiarize yourself with the exam format and expectations. Analyze the model answers to understand how to apply the strategies discussed effectively.
Common Mistakes to Avoid
- Misinterpreting the data: Carefully analyze the visual before writing to avoid drawing inaccurate conclusions.
- Overly relying on data: While it’s crucial to include data, avoid simply listing figures. Focus on interpreting and analyzing the information.
- Ignoring key features: Make sure to cover the most significant information presented in the visual.
- Using informal language: Maintain a formal and objective tone throughout your writing.
- Exceeding the word limit: Aim to write between 150-190 words to allocate sufficient time for other sections.
Conclusion
Improving your IELTS Academic Writing Task 1 performance requires a combination of understanding the task requirements, developing effective writing strategies, and consistent practice. By carefully analyzing the visual data, structuring your response logically, using a variety of grammatical structures and vocabulary, and learning from your mistakes, you can significantly enhance your ability to achieve a higher band score. Remember to approach this task with a clear and analytical mindset, and practice regularly with authentic materials to build your confidence.