Writing Task 1 of the IELTS exam can be daunting. Achieving a band 6 means meeting several specific criteria. This article provides detailed insights and practical approaches to help you improve your Writing Task 1 scores while naturally incorporating common user queries and semantic-related keywords.
Understanding IELTS Writing Task 1
What is IELTS Writing Task 1?
IELTS Writing Task 1 involves describing visual data such as a graph, chart, table, or diagram. You are expected to write a concise report of at least 150 words in 20 minutes.
Band 6 Criteria
To achieve a band 6, your response must:
- Address the task appropriately.
- Present accurate and relevant information.
- Show a range of vocabulary and grammatical structures with some errors.
- Demonstrate an attempt at organizing information logically.
Common Queries:
- How can I elaborate on the main points in Task 1?
- What are typical errors in Writing Task 1 that lead to lower scores?
- How can I organize my answer effectively?
Examples and Techniques
Analyzing the Data
Step-by-Step Approach:
- Introduction: Paraphrase the question prompt.
- Overview: Identify two key trends or features.
- Details: Provide specific data points and comparisons.
Example:
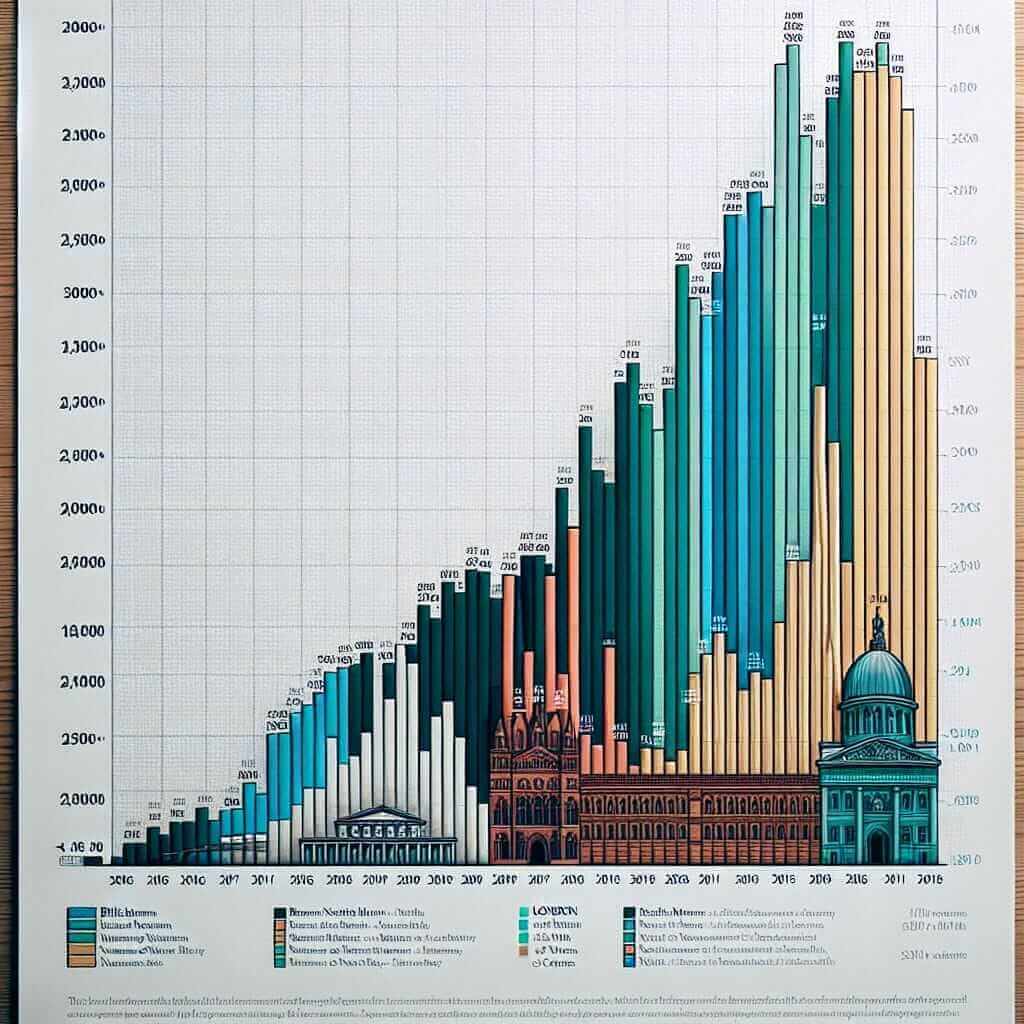
Question: The chart below shows the number of visitors to three different museums in London between 2006 and 2015.

Response:
- Introduction: The bar chart illustrates the number of people visiting three different museums in London, spanning from 2006 to 2015.
- Overview: Overall, the British Museum was the most visited throughout the period, while both the Natural History Museum and the Science Museum witnessed fluctuations.
- Details: The British Museum started at around 4.5 million visitors in 2006, rising steadily to 6.5 million in 2015…
Trends and Comparisons
Identify trends and make comparisons to elevate your response. Use phrases like “compared to,” “in contrast,” and “a significant rise.”
Example Phrases:
- The number of visitors to the British Museum saw a significant increase.
- In contrast to the British Museum, the Science Museum’s attendance figures remained relatively stable.
Task 1 Types and Structures
Line Graph:
- Introduction: Paraphrase.
- Overview: Trends and general movements.
- Details: Specific data points at key time periods.
Example:
A line graph showing the number of car accidents in a city between 2010 and 2019.
Common Mistakes to Avoid
Inaccurate Data Representation:
Avoid misrepresenting data. For example, if the chart shows a figure of 2.5 million, ensure your writing reflects this accurately.
Repetition:
Do not continuously repeat the same vocabulary or sentence structures. This can limit your score.
Overview Issues:
Failing to provide a clear overview can significantly hurt your score. Always ensure your overview captures the main trends or features.
Practice and Improvement Strategies
Writing Regularly:
Practice by writing full responses under timed conditions. This will help improve both speed and accuracy.
Reviewing Model Answers:
Analyze high-scoring responses to understand effective structures and language use. Websites such as IELTS.org and Cambridge provide exemplary answers.
Getting Feedback:
Have your practice responses reviewed by a teacher or a peer. Constructive criticism will help you identify and correct your mistakes.
Conclusion
Achieving band 6 in IELTS Writing Task 1 requires understanding the task, practicing diligently, and learning from errors. Remember to paraphrase effectively, identify key trends, and present accurate data. Lastly, continuous practice and feedback are crucial for improvement.
Feel free to leave comments or visit other sections of our website for more tips and resources on mastering the IELTS exam!