The IELTS Writing Task 1 can seem daunting, especially when faced with a graph, chart, or diagram you’ve never seen before. A strong start can calm those nerves and set the tone for a well-structured and high-scoring response. As an IELTS instructor with over 20 years of experience, I’m here to share a winning formula to help you confidently begin your Writing Task 1 and pave your way to IELTS success.
Understanding the Importance of a Strong Introduction
First impressions matter. In IELTS Writing Task 1, your introduction plays a crucial role in demonstrating your understanding of the task and your ability to paraphrase effectively. A weak introduction can lead to confusion and ultimately impact your overall score.
Crafting Your Opening Sentence: Setting the Stage
Your opening sentence should clearly identify the type of visual information presented. Avoid simply copying the question prompt; instead, use synonyms and different sentence structures to paraphrase.
For Example:
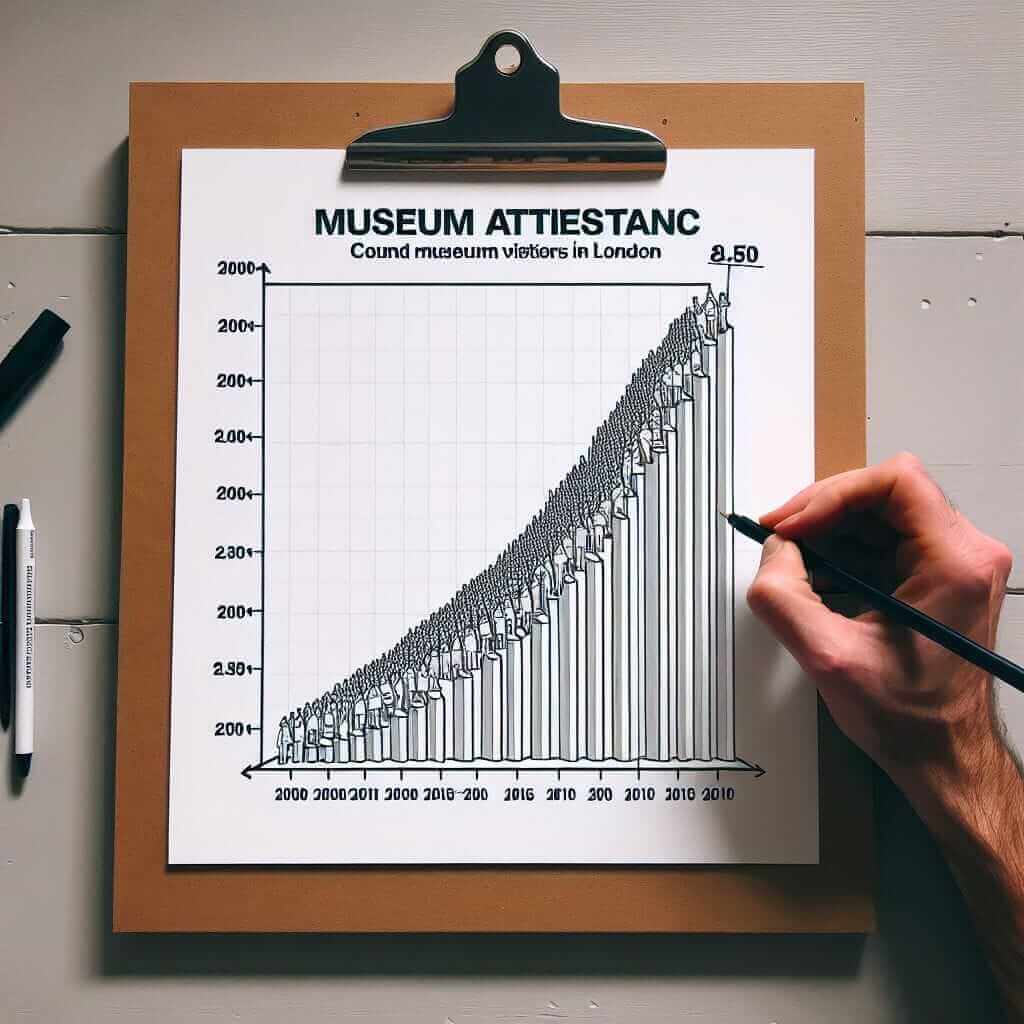
- Prompt: The graph below shows the number of people who visited a museum in London between 2000 and 2010.
- Effective Opening Sentence: The line graph illustrates the museum attendance figures in London over a decade, from 2000 to 2010.
Stating the Key Trend: Highlighting the Main Feature
The second sentence of your introduction should summarise the most significant trend or pattern displayed in the visual information. This demonstrates your ability to identify key information and present it concisely.
Example:
- Prompt: The chart below shows the percentage of households in the UK with access to different technologies.
- Effective Second Sentence: Overall, the chart reveals a significant increase in the ownership of computers and smartphones, while landline phone ownership has declined steadily.

Example Introduction Paragraphs
Let’s look at how to combine these elements into effective introductions for different types of visual data:
Line Graph:
The line graph depicts the average monthly temperatures in Celsius in Toronto, Canada, from January to December. As the graph indicates, temperatures generally rise from January, reaching a peak in July, before gradually decreasing towards December.
Bar Chart:
The bar chart compares the average weekly spending on groceries in four different countries. It is evident from the chart that consumers in the USA spend the most on groceries per week, followed by those in the UK and Australia, while spending in India is considerably lower.
Pie Chart:
The pie chart illustrates the proportion of energy produced from different sources in France in 2022. Renewable energy sources, including solar, wind, and hydro, accounted for the largest share of energy production.
Tips for a Winning Introduction:
- Keep it Concise: Aim for 2-3 sentences, focusing on clarity and brevity.
- Paraphrase Effectively: Use synonyms and different sentence structures to avoid repetition and demonstrate your vocabulary range.
- Focus on Accuracy: Ensure your introduction accurately reflects the information presented in the visual data.
- Proofread Carefully: Check for any grammatical or spelling errors that could impact your score.
Conclusion
Mastering the art of writing effective introductions for IELTS Writing Task 1 is crucial for achieving a high score. By understanding the key elements, using effective paraphrasing techniques, and practicing regularly, you can confidently approach this task and improve your overall IELTS writing performance. Remember, a strong start can make all the difference!