As an IELTS instructor with over two decades of experience, I’ve seen firsthand how the Writing Task 1 can often seem daunting for test-takers. Describing graphs, charts, or diagrams effectively requires a specific skill set, but with the right approach and practice, you can confidently tackle this section and boost your overall IELTS score.
Understanding the Importance of Graph Description in IELTS
The ability to interpret and present visual data is a crucial skill in academic and professional settings. The IELTS Writing Task 1 assesses your competence in:
- Data Analysis: Identifying key trends, patterns, and significant details presented visually.
- Language Skills: Using accurate vocabulary and grammar to describe trends, make comparisons, and present information coherently.
- Conciseness and Clarity: Conveying information clearly and effectively within the time limit, adhering to a 150-word minimum.
A Step-by-Step Guide to Writing about Graphs in IELTS
Let’s break down the process of crafting a successful graph description for your IELTS Writing Task 1:
1. Analyze the Graph Carefully
Before you start writing, spend a few minutes thoroughly examining the provided graph or chart. Pay close attention to:
- Type of Graph: Is it a line graph, bar chart, pie chart, table, or a combination? Each type presents information differently.
- Axes and Labels: Understand what each axis represents and the units of measurement used. Read all labels carefully.
- Key Trends: What are the most noticeable changes or patterns in the data? Look for peaks, troughs, plateaus, and overall trends.
- Time Period: If applicable, note the time frame covered by the data and any significant time intervals.
2. Structure Your Response Effectively
A well-organized response is crucial for clarity. Follow this structure:
Introduction (1-2 sentences):
- Paraphrase the Task: Rephrase the question prompt in your own words to demonstrate understanding.
- Overview: Provide a general statement summarizing the main trends shown in the graph.
Body Paragraphs (2-3 paragraphs):
- Group Data Logically: Divide the information into meaningful categories or time periods.
- Highlight Key Features: Focus on the most significant changes, using specific data points to support your observations.
- Compare and Contrast: When relevant, compare and contrast different data sets or trends.
Conclusion (1 sentence, optional):
- Briefly summarize the main trends. This is optional, and you may omit it if you are short on time.
3. Use Precise Vocabulary and Grammar
Accurate language is essential for a high score.
Vocabulary:
- Verbs and Nouns: Employ verbs like “increase,” “decrease,” “fluctuate,” “peak,” and nouns such as “trend,” “pattern,” “growth,” “decline.”
- Adverbs and Adjectives: Use adverbs like “steadily,” “sharply,” “significantly” and adjectives like “dramatic,” “gradual,” “substantial.”
- Prepositions: Use prepositions accurately to describe changes over time (e.g., “from…to,” “between…and,” “by…”).
Grammar:
- Tenses: Use appropriate tenses to reflect the time period shown in the graph.
- Comparisons: Master comparative and superlative forms for making accurate comparisons.
- Data Referencing: Practice using language to refer to data accurately (e.g., “The number of…,” “The percentage of…”).
4. Illustrative Examples from IELTS
Let’s analyze a sample IELTS graph and apply these steps:
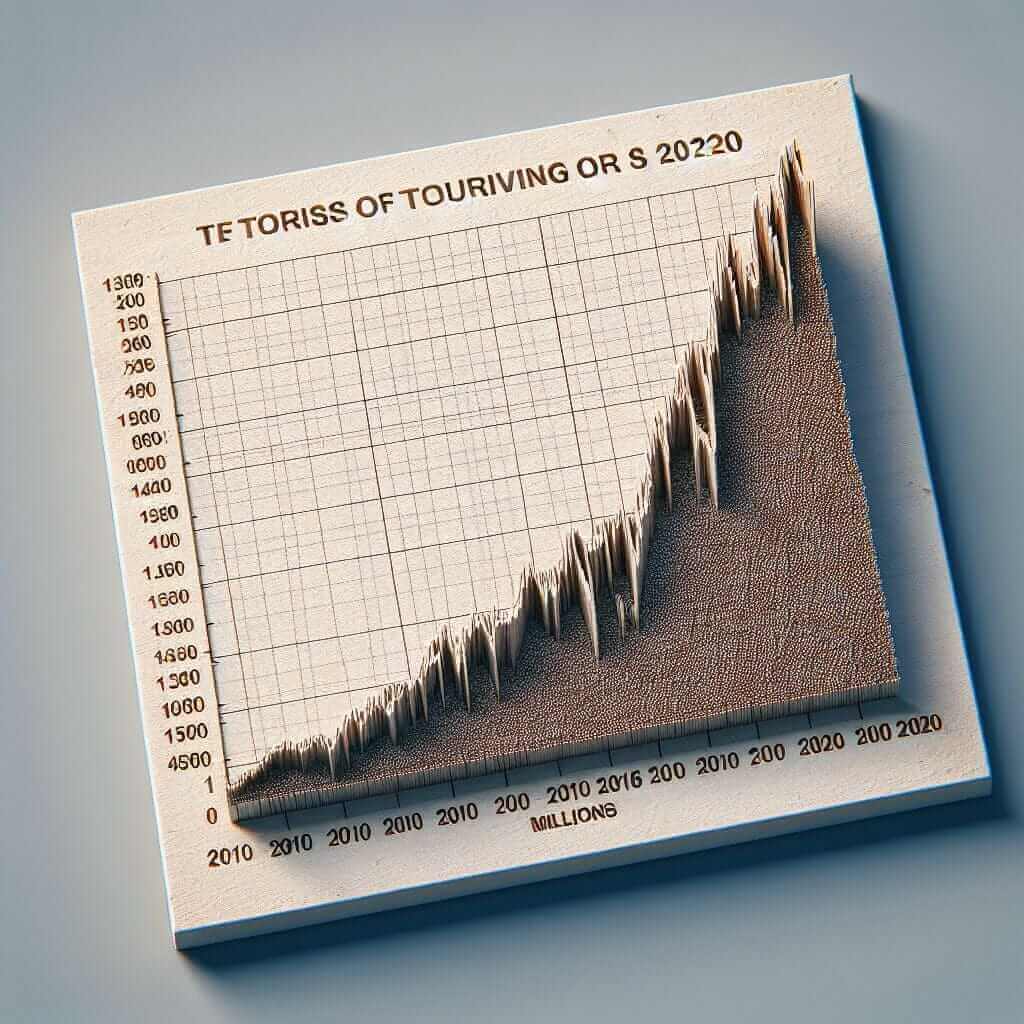
(Imagine a line graph showing the number of tourists visiting a country over a decade.)

Introduction:
The line graph illustrates the changes in the number of tourists visiting [Country Name] over a ten-year period, from 2010 to 2020.
Body Paragraph 1:
From 2010 to 2015, tourist numbers showed a steady increase, rising from 1 million to 1.8 million. This upward trend can be attributed to… [Explain possible reasons].
Body Paragraph 2:
However, from 2016 onwards, there was a marked decline in tourist arrivals, falling to a low of 1.2 million in 2018. This decrease coincided with… [Mention potential causes].
Conclusion (optional):
In conclusion, the graph reveals fluctuating tourist numbers in [Country Name] over the decade, with a notable decline in the latter half of the period.
Tips for Success in IELTS Graph Description:
- Practice Regularly: Familiarize yourself with different graph types and practice writing descriptions under timed conditions.
- Focus on Accuracy: Prioritize clear and accurate data representation over complex language if needed.
- Seek Feedback: Have your writing evaluated by a teacher or tutor to identify areas for improvement.
- Read Sample Responses: Analyze high-scoring sample answers to understand effective language use and organization.
Mastering the art of describing graphs for the IELTS Writing Task 1 is achievable with focused practice and a strategic approach. By following these guidelines and honing your analytical and language skills, you’ll be well-equipped to excel in this section of the IELTS exam.