As an IELTS instructor with over two decades of experience, I understand the challenges students face when tackling the IELTS Academic Writing Task 1. This comprehensive guide will provide you with a clear understanding of the task, equip you with effective strategies, and offer practical tips to help you achieve a high band score.
Nội dung bài viết
Understanding IELTS Academic Writing Task 1
The IELTS Academic Writing Task 1 assesses your ability to interpret and describe visual data presented in various formats, such as graphs, charts, tables, diagrams, and maps. You are required to write a minimum of 150 words within a 20-minute timeframe.
Key Steps to Master IELTS Academic Writing Task 1
1. Analyze the Visual Information
Identify the type of visual: Is it a line graph, bar chart, pie chart, table, diagram, or map? Understanding the visual format will guide your interpretation of the data.
Determine the main features: Look for the most significant trends, patterns, or changes in the data. What are the highest and lowest values? Are there any significant differences or similarities?
Read the labels and units carefully: Pay close attention to the axes labels, legends, and units of measurement. These provide crucial context for interpreting the data.
2. Plan Your Response
Paraphrase the question: Begin your essay by restating the task instructions in your own words. This demonstrates your understanding of the task and your ability to paraphrase effectively.
Create an outline: Organize your thoughts and structure your essay logically. Divide your analysis into paragraphs, each focusing on a specific aspect of the data.
3. Write a Coherent and Cohesive Essay
Introduction (1-2 sentences): Briefly introduce the type of visual and the main topic it represents.
Overview (2-3 sentences): Provide a general overview of the key trends, patterns, or changes in the data. Avoid specific details in this section.
Body Paragraphs (2-3 paragraphs): Analyze the data in detail, supporting your statements with specific figures and comparisons. Use appropriate vocabulary to describe trends, changes, and comparisons.
Conclusion (1-2 sentences): Summarize the main findings and avoid introducing new information.
4. Use a Variety of Grammatical Structures and Vocabulary
Tenses: Use appropriate tenses to describe the time frame of the data.
Comparatives and Superlatives: Use comparatives and superlatives to highlight differences and similarities in the data.
Trend Vocabulary: Utilize a wide range of vocabulary to describe trends, such as increase, decrease, fluctuate, peak, plateau, etc.
Example from an IELTS Exam
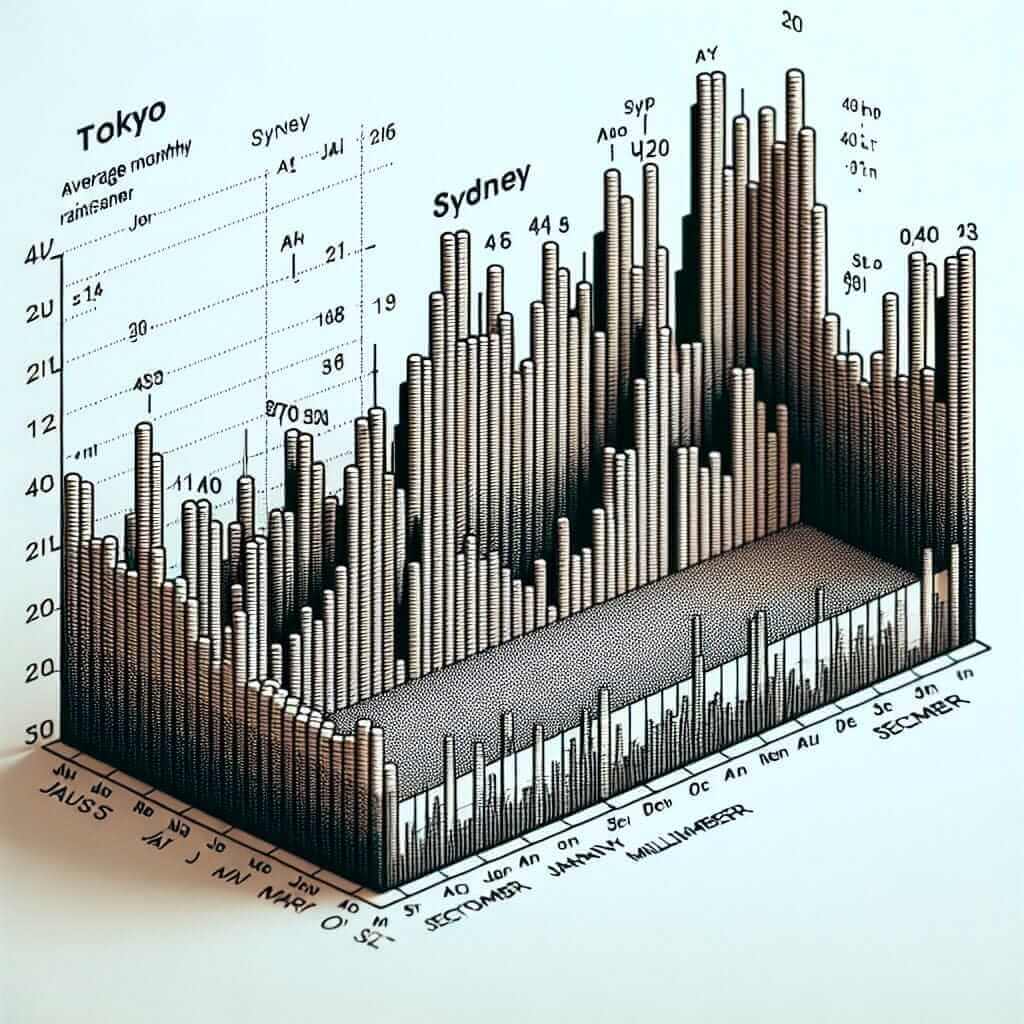
The chart below shows the average monthly rainfall in Tokyo and Sydney over a year.

Summarize the information by selecting and reporting the main features and make comparisons where relevant.
Sample Answer
The bar chart illustrates the average monthly rainfall in millimeters for two cities, Tokyo and Sydney, throughout a calendar year.
Overall, Sydney experiences significantly higher rainfall than Tokyo during the given period. The wettest month in Sydney is February, with approximately 150 mm of rainfall, whereas Tokyo’s highest rainfall occurs in September, reaching just over 200 mm.
In Tokyo, rainfall gradually increases from January (around 50 mm) to September before decreasing significantly in the following months, reaching its lowest point in December (just below 50 mm). Conversely, Sydney’s rainfall remains relatively consistent throughout the year, with a slight dip in October (around 60 mm) and November (around 70 mm).
Tips for Success
- Practice regularly: Familiarize yourself with different types of visuals and practice writing task 1 essays under timed conditions.
- Seek feedback: Have your writing assessed by an experienced IELTS instructor to identify areas for improvement.
- Expand your vocabulary: Learn and use a wide range of vocabulary related to describing trends, changes, and comparisons.
- Proofread carefully: Allow time to review your essay for any grammatical errors or inconsistencies in your writing.
By following these steps and consistently practicing, you will develop the necessary skills and confidence to excel in the IELTS Academic Writing Task 1. Remember, clear understanding, effective planning, and accurate language are key to achieving a high band score.