As an IELTS instructor with over 20 years of experience, I’ve witnessed countless students grapple with the IELTS Writing Task 1, particularly when faced with line graphs. Many find it challenging to effectively describe trends, compare data, and use the appropriate vocabulary for a high score. This comprehensive guide will demystify the process of writing a Band 9 line graph essay for IELTS, providing you with the tools and strategies you need to succeed.
Understanding Line Graphs in IELTS Writing
Line graphs are a common visual representation of data in the IELTS Writing Task 1. They depict changes in one or more variables over a specific period of time. Your task is to analyze the graph, identify key features, and present a well-structured and accurate overview in your own words.
Essential Steps to Write a Stellar Line Graph Essay
1. Analyze the Line Graph Carefully
Before you start writing, take a few moments to thoroughly analyze the graph. Pay close attention to the:
- Title: This provides the context for the data presented.
- Axes: Identify the variables being measured on both the x-axis (usually time) and the y-axis.
- Units of measurement: Note the units used for each variable (e.g., percentages, millions, kilograms).
- Key periods: Look for significant changes, trends, peaks, and troughs in the data.
- Relationship between multiple lines: If there are multiple lines, analyze how they relate to each other – do they show similar or contrasting trends?
2. Structure Your Essay Effectively
A well-structured essay is crucial for clarity and coherence. Follow this four-paragraph structure for your line graph essay:
Paragraph 1: Introduction
- Paraphrase the information given in the title of the graph.
- Briefly state the overall trend(s) shown in the graph.
Paragraph 2: Overview
- Provide a general overview of the most significant trends, without going into specific details.
- Highlight key features, such as the highest and lowest points, periods of stability, and any notable fluctuations.
Paragraph 3: Detailed Description
- Select and describe the most important trends in more detail.
- Use specific data from the graph to support your statements.
- Compare and contrast different data points or trends, where relevant.
Paragraph 4: Conclusion (Optional)
- Briefly summarize the main trends again.
- You may include a concluding sentence to add a final thought, but this is not mandatory.
3. Use Precise Vocabulary and Grammar
To achieve a high score, it’s essential to demonstrate a wide range of vocabulary and grammatical structures. Here are some useful phrases for describing trends in line graphs:
Describing Upward Trends:
- Increase/rise/grow/climb/go up/surge: “The number of students enrolling in online courses increased dramatically between 2010 and 2020.”
- An upward trend/an increasing trend: “There was a clear upward trend in the consumption of organic food.”
- To peak/to reach a peak: “Sales peaked in December, reaching a high of $10 million.”
Describing Downward Trends:
- Decrease/fall/drop/decline/reduce/dip: “The unemployment rate fell steadily throughout the decade.”
- A downward trend/a decreasing trend/a decline: “There was a marked downward trend in the number of smokers.”
- To hit a low/to reach a low point: “Profits hit a low in 2008, bottoming out at $5 million.”
Describing Other Trends:
- To remain stable/constant/unchanged/steady: “The population remained relatively stable during this period.”
- To fluctuate: “The price of gold fluctuated throughout the year.”
- To level off: “After a period of growth, sales levelled off in the second quarter.”
Use a Variety of Grammatical Structures:
- Use different verb tenses (past simple, present perfect, future) to accurately reflect the time frame of the data.
- Employ a mix of simple, compound, and complex sentences.
- Utilize connectors and transition words (e.g., however, although, similarly, in contrast) to ensure a smooth flow of ideas.
4. Practice with Real IELTS Line Graph Questions
The best way to prepare is to practice! Familiarize yourself with authentic IELTS Writing Task 1 prompts and work through them regularly. Analyze sample answers and pay attention to the language, structure, and overall approach.
Example Line Graph Question and Answer
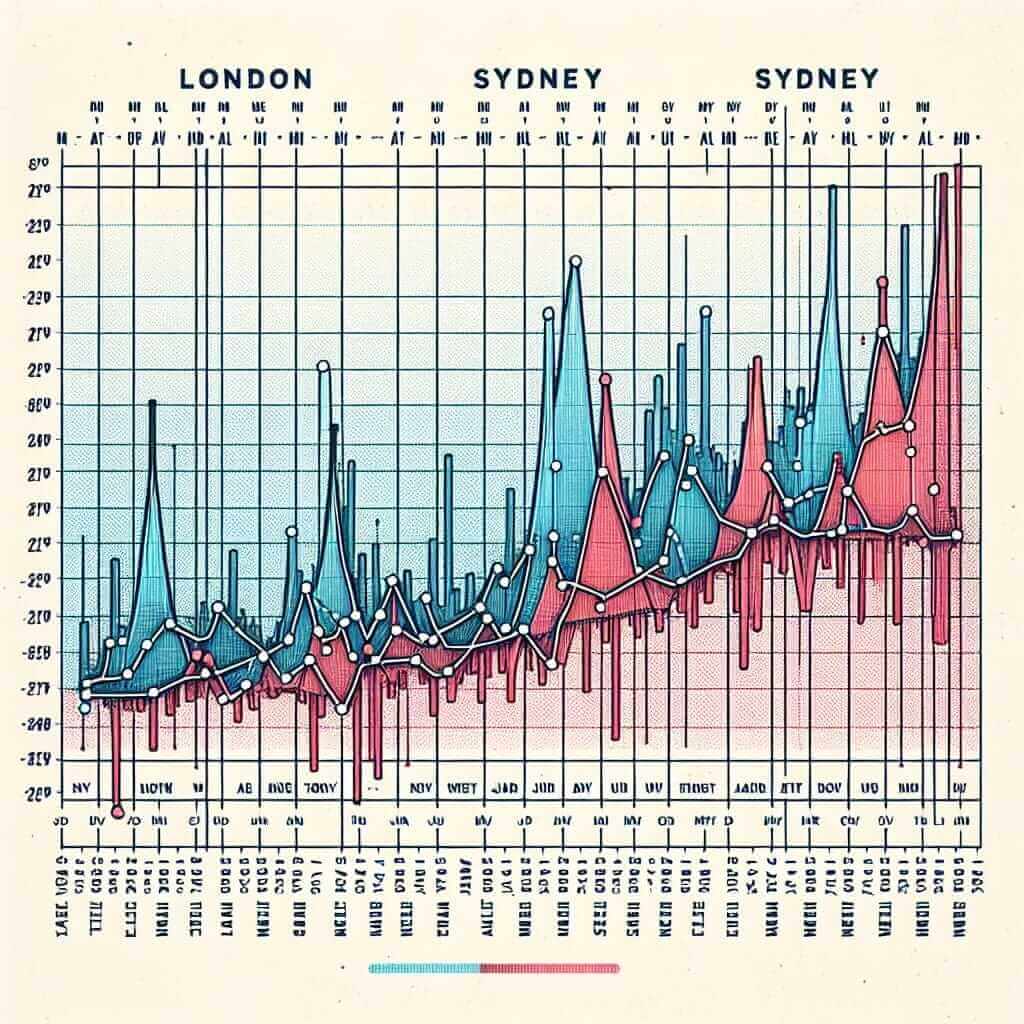
The line graph below shows the average monthly temperatures in London and Sydney over a year.

Summarize the information by selecting and reporting the main features, and make comparisons where relevant.
Sample Answer:
The line graph illustrates the average monthly temperatures in two major cities: London, UK, and Sydney, Australia, over the course of a year.
Overall, Sydney experiences a warmer climate than London throughout the year. While London’s temperatures are at their highest in July and August, peaking at around 23 degrees Celsius, Sydney enjoys its warmest months from December to February, with temperatures averaging around 25 degrees Celsius.
In contrast, London endures much colder winters than Sydney. January is the coldest month in London, with temperatures dropping to an average of 5 degrees Celsius. Sydney, on the other hand, experiences mild winters, with temperatures hovering around 15 degrees Celsius in July, its coolest month.
It is also worth noting that London’s temperatures fluctuate more dramatically throughout the year, while Sydney’s climate remains relatively consistent.
Tips to Achieve a Band 9 in Your Line Graph Essay
- Be selective: Don’t try to describe every single detail in the graph. Focus on the most significant trends and support your observations with specific data.
- Maintain accuracy: Ensure your description accurately reflects the information presented in the graph. Avoid making assumptions or drawing conclusions that are not supported by the data.
- Proofread carefully: Grammatical errors and spelling mistakes can lower your score. Allocate time to thoroughly proofread your essay before submitting it.
By following these strategies and practicing regularly, you can confidently tackle any line graph question in the IELTS Writing Task 1 and achieve your desired band score. Good luck!