In the realm of IELTS Writing Task 1, where data visualization meets linguistic prowess, the overview plays a pivotal role. It’s your opportunity to demonstrate a clear grasp of the presented information and provide the examiner with a roadmap to your analysis. Many candidates, however, find crafting a concise yet insightful overview a significant challenge. Fear not! This comprehensive guide will equip you with the knowledge and strategies to conquer this crucial element of your IELTS Writing Task 1.
The Importance of a Strong Overview
Your overview is not merely a summary; it’s an analytical highlight reel. It should encapsulate the key trends, patterns, or changes depicted in the visual data (graphs, charts, diagrams, etc.). A well-written overview demonstrates your ability to:
- Comprehend complex information: You can quickly identify the most significant aspects of the data.
- Summarize effectively: You can condense key information into a concise and coherent paragraph.
- Analyze and interpret: You can go beyond simple description and highlight the main trends.
A strong overview paves the way for a well-structured and coherent response, ultimately boosting your overall band score.
How to Write an Effective Overview
Writing a stellar overview involves a blend of observation, analysis, and concise language. Here’s a step-by-step approach:
1. Identify the Main Features
Carefully examine the provided visual data and pinpoint the most striking features. Ask yourself:
- What are the most noticeable trends? Is there an overall increase or decrease?
- Are there any significant peaks, troughs, or fluctuations?
- What are the highest and lowest values?
- Are there any notable similarities or differences between the data sets?
2. Focus on Overall Trends, Not Details
Resist the urge to delve into specific figures in the overview. Your goal is to present a general picture of the data. Use language that highlights the overarching patterns. For instance, instead of writing “The number of students who chose science as their major increased from 200 to 250,” opt for “There was a noticeable increase in the number of students opting for science majors.”
3. Use Effective Language and Vocabulary
Employ language that signals analysis and interpretation. Some useful phrases include:
- Overall, the data shows…
- The most striking trend is…
- In general, it can be seen that…
- A significant change is observed in…
- There is a clear trend of…
Remember to vary your vocabulary and avoid repetition.
4. Keep it Concise
Your overview should ideally be 2-3 sentences long, encompassing no more than 30 words. Be mindful of your word count and prioritize clarity and conciseness.
Example: From Data to Overview
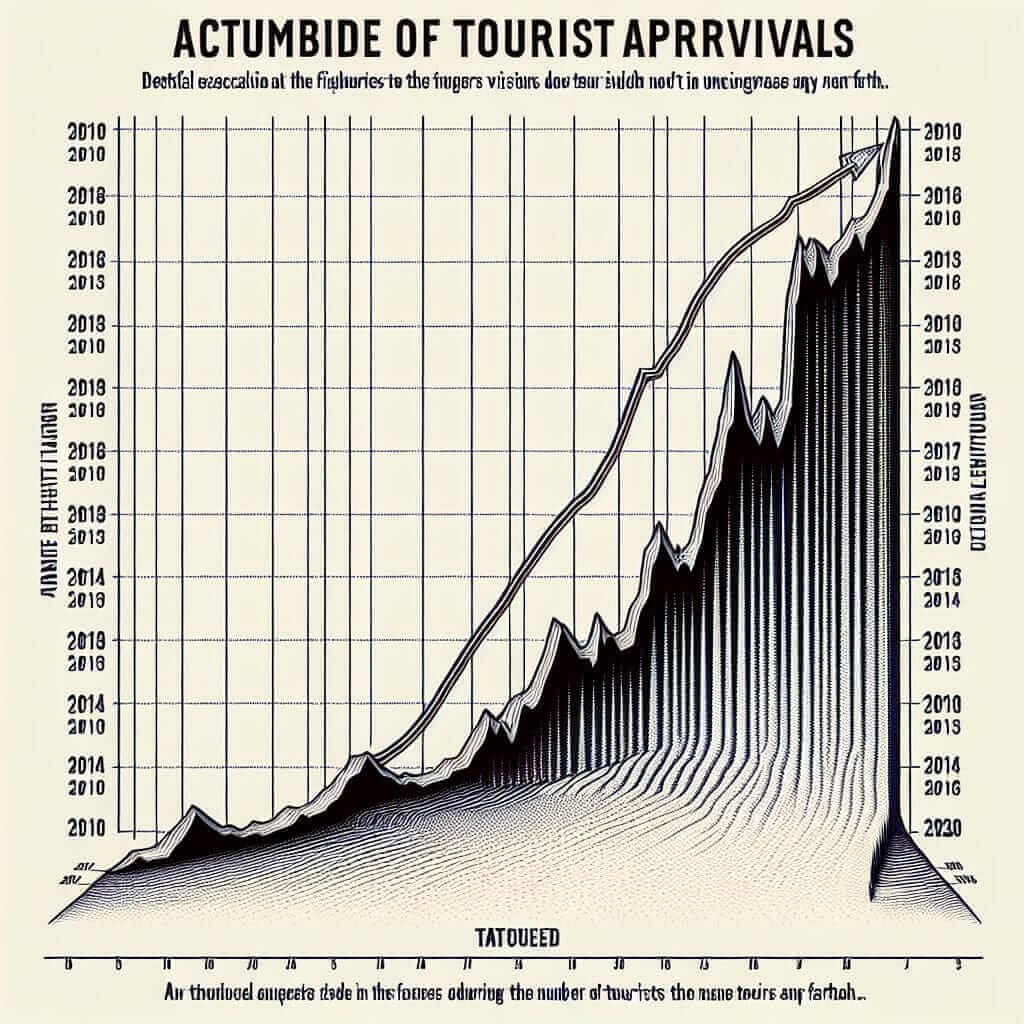
Let’s consider a line graph depicting the number of tourists visiting a particular country over a decade.

Data: The graph shows a steady increase in tourist arrivals from 2010 to 2018, followed by a plateau between 2018 and 2019, and a sharp decline in 2020.
Overview: The graph illustrates the trend in tourist arrivals to [Country Name] over a decade. Overall, the number of tourists visiting the country increased significantly between 2010 and 2019, with a notable surge in the later years. However, the year 2020 witnessed a dramatic drop in tourist numbers.
Tips for Writing a High-Scoring Overview
- Practice, practice, practice: Regularly analyze different types of visual data and write overviews to hone your skills.
- Time management: Allocate sufficient time for each stage of the writing process, ensuring you have ample opportunity to craft a strong overview.
- Seek feedback: Have a teacher or IELTS expert review your writing and provide constructive criticism.
- Learn from model answers: Analyze high-scoring IELTS Writing Task 1 responses to understand the nuances of effective overviews.
Conclusion
Mastering the art of writing a concise, insightful overview is a crucial skill for success in the IELTS Writing Task 1. By following the guidelines outlined in this guide, practicing regularly, and incorporating feedback, you can significantly enhance your ability to analyze visual data effectively and present your findings with clarity and confidence.