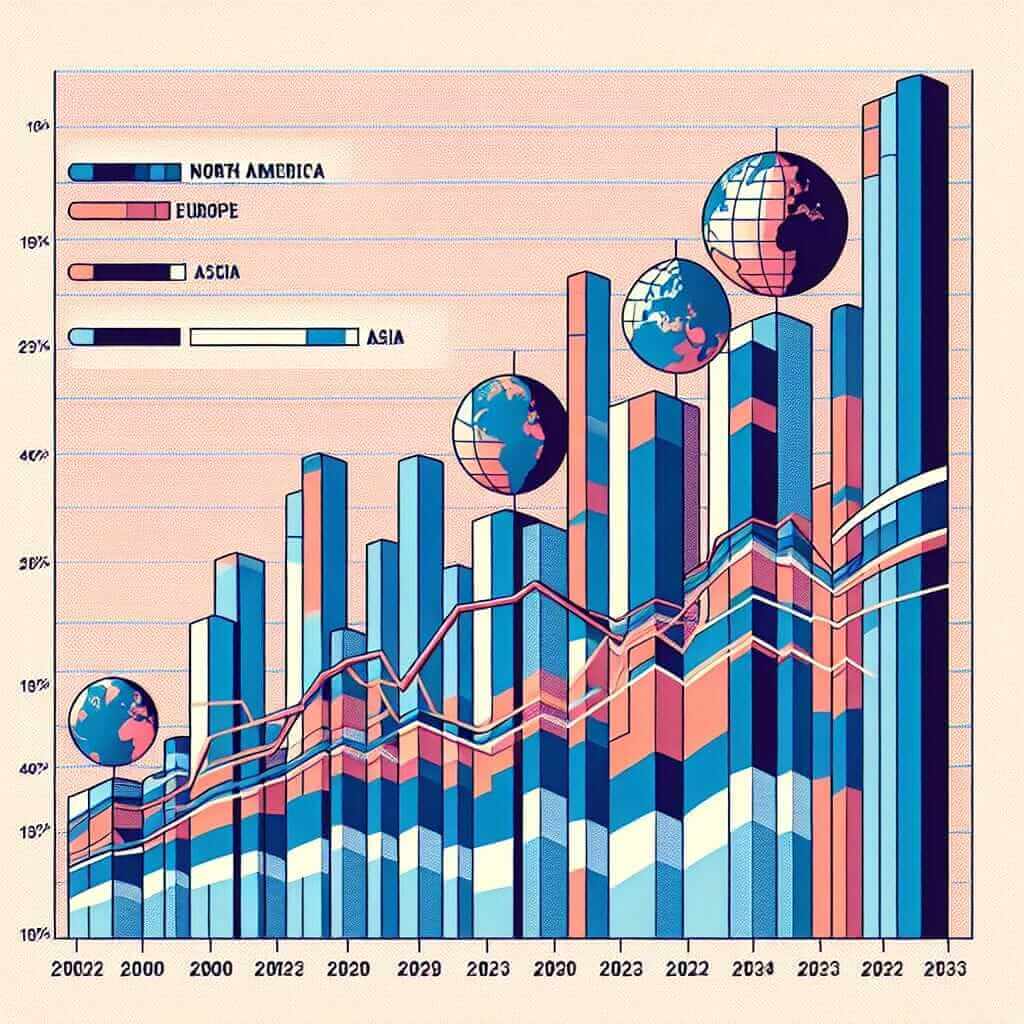
In recent years, the topic of Internet penetration rates in different regions has frequently appeared in the IELTS Writing Task 1 examination. Understanding how to analyze, interpret, and present such data accurately is crucial for achieving a high band score.
Introduction
The topic of Internet penetration rates is relevant due to the rapid growth of Internet users globally. In recent IELTS exams, candidates are often required to interpret data related to technology usage and its spread across various regions. Below are some sample tasks that could appear in the exam:
- “The line graph below shows the percentage of Internet users in different regions from 2000 to 2023.”
- “The table below provides information on the Internet penetration rates in North America, Europe, and Asia over a two-decade span from 2000 to 2023.”
- “The bar chart illustrates the growth of Internet users in Africa, Latin America, and Oceania from 2000 to 2023.”
In this article, we will select one of these tasks and create a model answer, followed by a detailed analysis of vocabulary, grammar, and useful tips for achieving a Band 7+ score.
Task Selection
We will choose the first sample task for our model answer:
“The line graph below shows the percentage of Internet users in different regions from 2000 to 2023.”
Data Interpretation
For the purpose of this exercise, let’s create a hypothetical line graph with the following data points:
| Year | North America | Europe | Asia | Africa |
|------|---------------|--------|------|--------|
| 2000 | 20%           | 10%    | 5%   | 2%     |
| 2005 | 40%           | 30%    | 15%  | 5%     |
| 2010 | 60%           | 50%    | 30%  | 10%    |
| 2015 | 70%           | 60%    | 45%  | 20%    |
| 2020 | 80%           | 75%    | 55%  | 30%    |
| 2023 | 85%           | 78%    | 65%  | 35%    |
(Note: These figures are hypothetical and used for illustrative purposes only.)

Model Answer
Analysis of the Task
Before we proceed to write our answer, it is essential to analyze the task. We need to:
- Identify the main trends and key features.
- Compare and contrast the data.
- Use a variety of sentence structures and vocabulary to present the information clearly and coherently.
Model Answer
The line graph illustrates the percentage of Internet users in North America, Europe, Asia, and Africa between 2000 and 2023.
Overall, North America consistently had the highest percentage of Internet users throughout the period, while Africa, despite significant growth, had the lowest. Notably, there was a steady increase in Internet penetration in all regions over the two decades.
In 2000, only 20% of North Americans used the Internet, but this figure grew rapidly to 85% by 2023. Europe followed a similar trend, with a notable increase from 10% in 2000 to 78% in 2023. Asia experienced the most significant growth, starting at 5% in 2000 and reaching 65% in 2023, reflecting the development and modernization of many Asian countries.
Africa, although starting with just 2% of its population using the Internet in 2000, saw a remarkable rise to 35% by 2023. This indicates substantial progress in internet accessibility, albeit at a slower rate compared to other regions.
In summary, while all regions saw impressive growth in Internet penetration rates from 2000 to 2023, North America and Europe were the leaders, with Asia and Africa showing robust upward trends.
Word Count: 197
Tips for Writing a High-Scoring Answer
- Identify Key Trends: Highlight the main trends and significant changes. Use comparative language to show how the data varies between regions and over time.
- Variety in Vocabulary: Use a range of vocabulary to avoid repetition. For example, instead of repeatedly using “increase,” consider synonyms like “rise,” “grow,” or “surge.”
- Grammar and Structure: Employ different sentence structures, such as complex and compound sentences, to demonstrate grammatical range.
- Clarity and Cohesion: Ensure that your response is clear and logically organized. Use linking words and phrases to ensure coherence between sentences and paragraphs.
Useful Vocabulary for the Task
Here is a list of important vocabulary words along with their parts of speech and pronunciation:
- Penetration (n.) /ˌpenəˈtreɪʃən/: The action or process of making a way through or into something.
- Consistently (adv.) /kənˈsɪstəntli/: In every case or on every occasion; invariably.
- Rapidly (adv.) /ˈræpɪdli/: Very quickly; at a great rate.
- Substantial (adj.) /səˈbænʃl/: Of considerable importance, size, or worth.
- Notably (adv.) /ˈnoʊtəbli/: In a way that is striking or remarkable.
- Steady (adj.) /ˈstədi/: Firmly fixed, constant, regular, or uniform.
- Accessibility (n.) /əkˌsɛmɪˈbɪləti/: The quality of being easy to obtain or use.
- Reflect (v.) /rɪˈflɛkt/: To give evidence of the character or quality of something.
- Indicate (v.) /ˈɪndɪkeɪt/: To show or point out.
- Trend (n.) /trɛnd/: A general direction in which something is developing or changing.
Conclusion
To summarize, when tackling graphs or charts on Internet penetration rates in different regions, it is essential to identify the key trends, use varied vocabulary, and ensure grammatical accuracy. By following the tips and utilizing the vocabulary provided, candidates can aim to achieve a Band 7+ in their IELTS Writing Task 1.
This guide should equip you with the necessary tools to approach similar tasks effectively and confidently.