The issue of ocean plastic pollution and subsequent cleanup efforts has become increasingly significant, frequently appearing in IELTS Writing Task 1. Understanding how to effectively describe and analyze visual data related to this topic is crucial for achieving a high band score.
Here are some potential IELTS Writing Task 1 questions related to this topic:
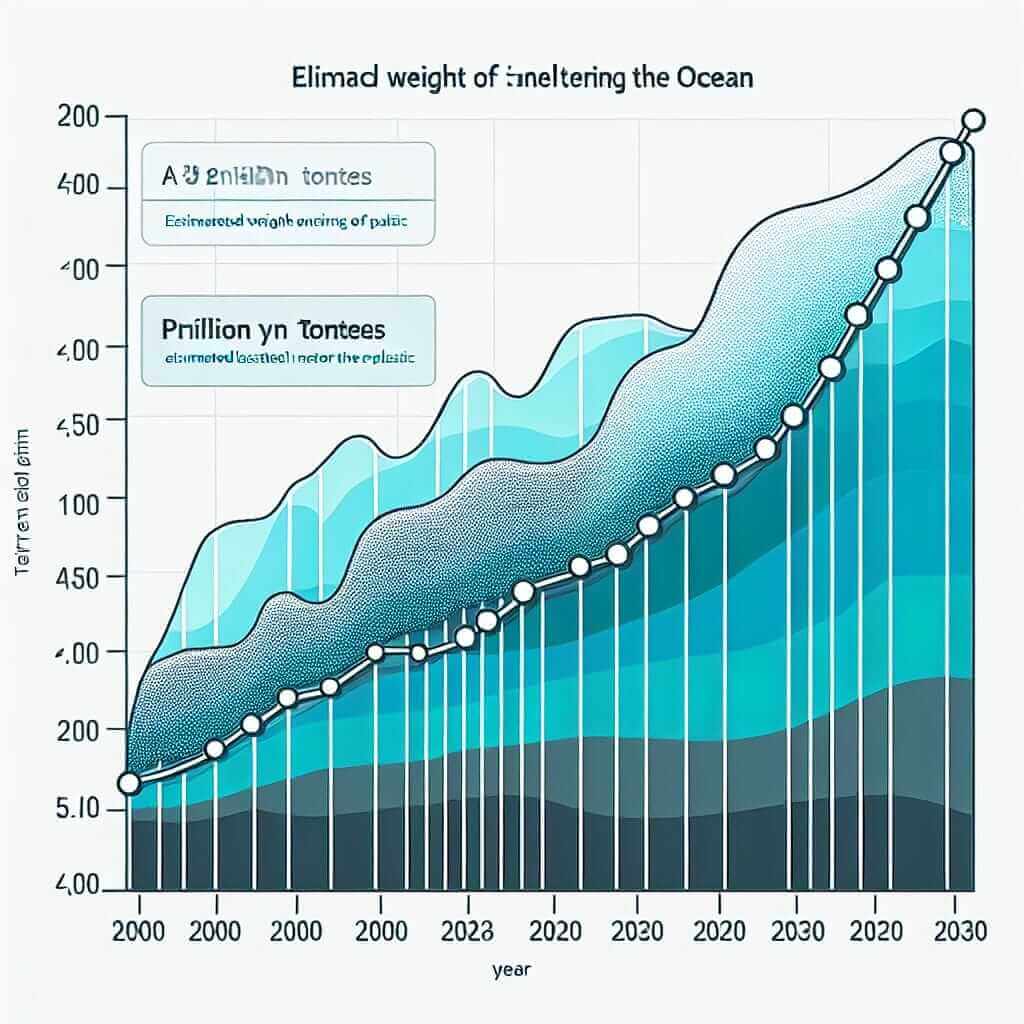
- The graph below shows the estimated weight of plastic entering the ocean annually from 2000 to 2020, and a projection for 2030.
- The table illustrates the percentage of different types of plastic waste collected during ocean cleanup initiatives in three different regions.
- The chart compares the effectiveness of various ocean plastic cleanup technologies in terms of the quantity of plastic removed per year.
Sample IELTS Writing Task 1 Question & Model Answer
Let’s focus on the first question for our sample task:
**The graph below shows the estimated weight of plastic entering the ocean annually from 2000 to 2020, and a projection for 2030.
Summarize the information by selecting and reporting the main features and make comparisons where relevant.**
(Insert a line graph here with the following data)

| Year | Estimated Weight of Plastic Entering Ocean (Million Tonnes) |
|---|---|
| 2000 | 8 |
| 2005 | 10 |
| 2010 | 12 |
| 2015 | 15 |
| 2020 | 18 |
| 2030 | 25 (Projected) |
Analysis of the Task
This task presents a line graph depicting a concerning trend of increasing plastic waste entering our oceans. As with all IELTS Writing Task 1 responses, we aim to write a minimum of 150 words and provide an accurate, well-organized report.
Model Answer
The line graph illustrates the alarming rise in the estimated weight of plastic pollution entering the world’s oceans from 2000 to 2020, with a projection for 2030.
In 2000, approximately 8 million tonnes of plastic waste ended up in the ocean. This figure rose steadily over the next decade, reaching 12 million tonnes in 2010. The rate of increase then accelerated, with an estimated 18 million tonnes of plastic polluting the ocean by 2020.
Disturbingly, the projection for 2030 paints an even bleaker picture, with an anticipated 25 million tonnes of plastic waste entering the ocean if current trends continue. This represents more than a threefold increase compared to the year 2000.
Overall, the graph highlights the escalating problem of ocean plastic pollution, underscoring the urgent need for effective global action to mitigate this environmental crisis.
(Word Count: 152 words)
Key Points to Remember
- Paraphrase the question: Rephrase the question prompt in your introduction to demonstrate understanding.
- Overview: Provide a concise overview summarizing the main trend(s) shown in the graph.
- Data Selection: Focus on the most significant data points, avoiding unnecessary detail.
- Comparisons: Highlight key differences or similarities in the data.
- Tenses: Use appropriate tenses to accurately describe past, present, and future trends.
- Vocabulary: Employ a range of vocabulary related to trends (e.g., increase, decrease, fluctuate, plateau) and proportions (e.g., double, triple, significant proportion).
Useful Vocabulary for Describing Trends
- Increase: rise, surge, climb, soar, escalate, skyrocket
- Decrease: decline, fall, drop, plummet, dwindle
- Fluctuate: vary, oscillate, swing
- Plateau: level off, stabilize
Difficult Vocabulary
- Mitigate (verb) /ˈmɪt.ɪ.ɡeɪt/: To make something less harmful, serious, or unpleasant.
- Underscore (verb) /ˌʌn.dɚˈskɔːr/: To emphasize the importance something.
- Anticipated (adjective) /ænˈtɪs.ə.peɪ.tɪd/: Expected or predicted.
- Bleak (adjective) /bliːk/: Not hopeful or encouraging; depressing.
- Threefold (adjective) /ˈθriː.foʊld/: Three times as big or as much.
Conclusion
Mastering the skills to analyze and describe visual data related to pressing global issues like ocean plastic cleanup is essential for IELTS Writing Task 1 success. Remember to practice regularly with different types of graphs and charts, focusing on accuracy, clarity, and the use of relevant vocabulary. Aim for a well-structured response that effectively communicates the key information to the reader, showcasing your ability to interpret and report on data in a sophisticated manner.