Understanding the topic of “Population Growth in Urban and Rural Areas (2000-2023)” is quite essential for IELTS candidates, particularly for those who want to excel in the Writing Task 1. This topic appears frequently, with variations in the datasets and trends. We’ll start by predicting from real data and crafting sample tasks similar to actual IELTS exam questions.
Sample Tasks:
- Sample Task 1: The graph below shows the population growth in urban and rural areas from 2000 to 2023. Summarize the information by selecting and reporting the main features and make comparisons where relevant.
- Sample Task 2: The table below shows the percentage change in population in urban and rural areas between 2000 and 2023. Summarize the information by selecting and reporting the main features and make comparisons where relevant.
- Sample Task 3: The charts below compare the population growth in urban and rural areas in three different countries from 2000 to 2023. Summarize the information by selecting and reporting the main features and make comparisons where relevant.
Choosing the Sample Task:
We will choose Sample Task 1 for our detailed analysis and writing. This task is often seen in the IELTS exam and covers significant aspects of data interpretation.
Data Representation:
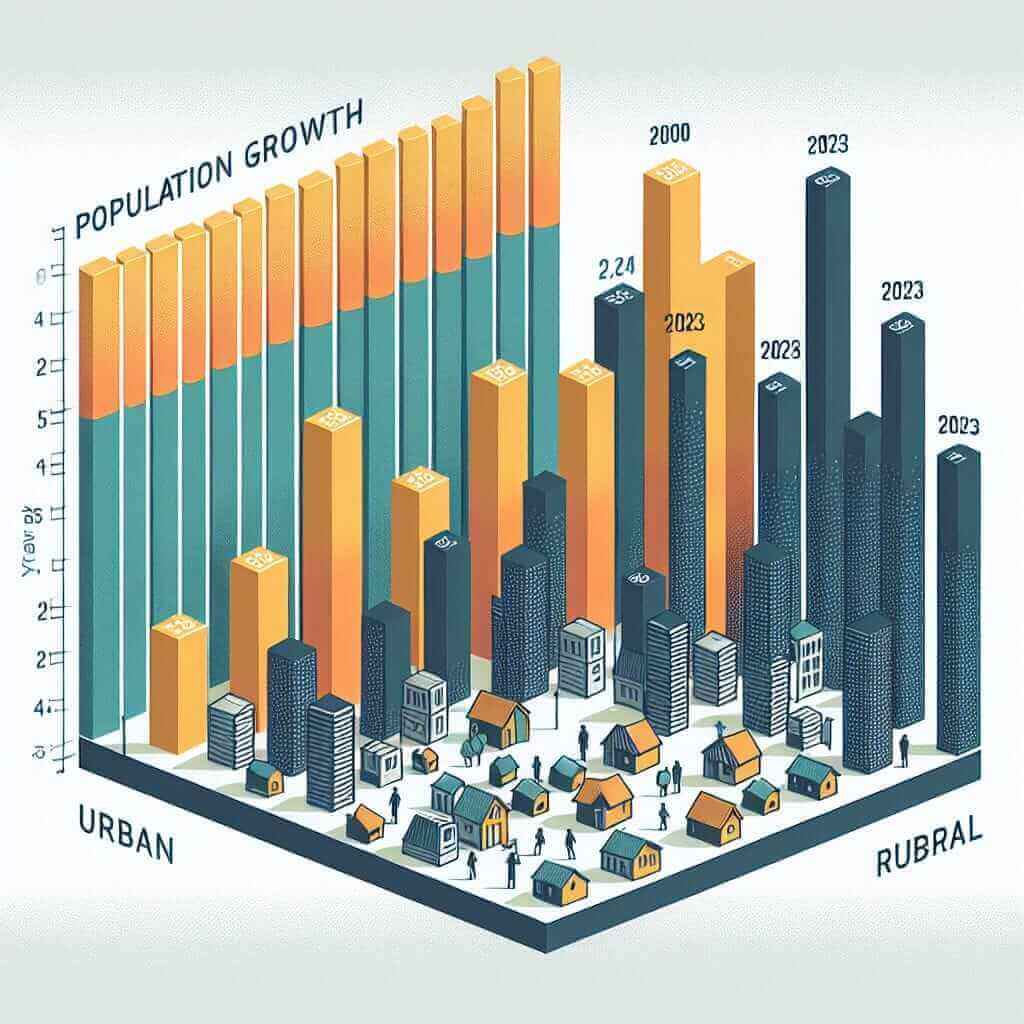
Let’s assume a bar graph showing population growth percentages in urban and rural areas from 2000 to 2023.
Hypothetical Data (in million):
| Year      | Urban Population | Rural Population |
|-----------|-------------------|------------------|
| 2000      | 3.0               | 2.0              |
| 2005      | 3.5               | 2.1              |
| 2010      | 4.2               | 2.2              |
| 2015      | 5.0               | 2.3              |
| 2020      | 5.9               | 2.5              |
| 2023      | 6.7               | 2.7              |
Analyzing the Task:
IELTS Writing Task 1 generally requires summarizing graphical data by identifying the main trends and making relevant comparisons. Let’s break down the steps:
- Introduction: Paraphrase the task in your own words.
- Overview: Provide an overall view highlighting significant trends.
- Details: Break down the data into detailed observations and make comparisons where necessary.
Sample Writing:
Introduction
The bar graph illustrates the population growth in urban and rural regions from 2000 to 2023.
Overview
Overall, the urban population has seen a substantial increase over the given period, whereas the rural population has experienced moderate growth. The urban areas have consistently had a higher population compared to rural areas throughout these years.
Detailed Analysis and Comparisons
In 2000, the urban population started at 3 million, significantly higher than the rural population of 2 million. By 2005, the urban population had grown to 3.5 million, while the rural population saw a more modest increase to 2.1 million.
The trend continued into 2010 with urban populations reaching 4.2 million and rural populations gradually rising to 2.2 million. By 2015, the urban population hit 5 million, and rural areas reached 2.3 million, indicating a more accelerated growth in urban regions.
The growth rate in urban areas surged by 2020, with the population reaching 5.9 million, while rural populations rose to 2.5 million. Finally, in 2023, the urban population peaked at 6.7 million, compared to 2.7 million in rural areas, reaffirming the trend of higher growth in urban demographics.
Word Count: 217 words
Key Vocabulary and Grammar Points:
Vocabulary:
- Substantial /səbˈstæn.ʃəl/ (adjective): Large in size, value, or importance.
- Moderate /ˈmɒd.ər.ət/ (adjective): Average in amount, intensity, or degree.
- Consistently /kənˈsɪs.tənt.li/ (adverb): In every case or on every occasion; invariably.
- Accelerated /əkˈsel.ə.reɪ.tɪd/ (adjective): Faster than usual.
- Peak /piːk/ (verb): Reach a highest point.
Grammar Highlights:
- Comparisons: Use comparative and superlative adjectives (higher, more modest, peaking at).
- Trend Description: Employing past simple tense to describe historical data (increased, reached, grew).
- Overview Sentence: Use the grammatical structure “has seen a…”
Conclusion
To master the IELTS Writing Task 1, it is vital to practice summarizing various forms of graphical data. Pay attention to identifying key trends and making relevant comparisons. Using a varied vocabulary and proper grammatical structures will help in achieving a Band 7+. Practice these techniques with different types of data to build confidence and proficiency.