In this article, we delve into the topic of “Public vs Private School Enrollment Rates (2000-2023)” to help you excel in the IELTS Writing Task 1. We’ll walk through understanding the topic, analyzing the data, and writing a well-structured response. Let’s begin!
Nội dung bài viết
Topic Analysis and Task Introduction
The enrollment rates in public and private schools can be a common topic in the IELTS Writing Task 1. Here are three possible task versions you might encounter:
- The chart below shows the percentage of students enrolled in public and private schools from 2000 to 2023. Summarize the information by selecting and reporting the main features, and make comparisons where relevant.
- The graph below illustrates the enrollment trends of public and private schools from 2000 to 2023. Summarize the information by selecting and reporting the main features, and make comparisons where relevant.
- The table below demonstrates the enrollment rates in public and private schools from 2000 to 2023. Summarize the information by selecting and reporting the main features, and make comparisons where relevant.
Let’s select one and create a detailed analysis and response.
Select a Task and Data Representation
We will work with the first version:
“The chart below shows the percentage of students enrolled in public and private schools from 2000 to 2023. Summarize the information by selecting and reporting the main features, and make comparisons where relevant.”
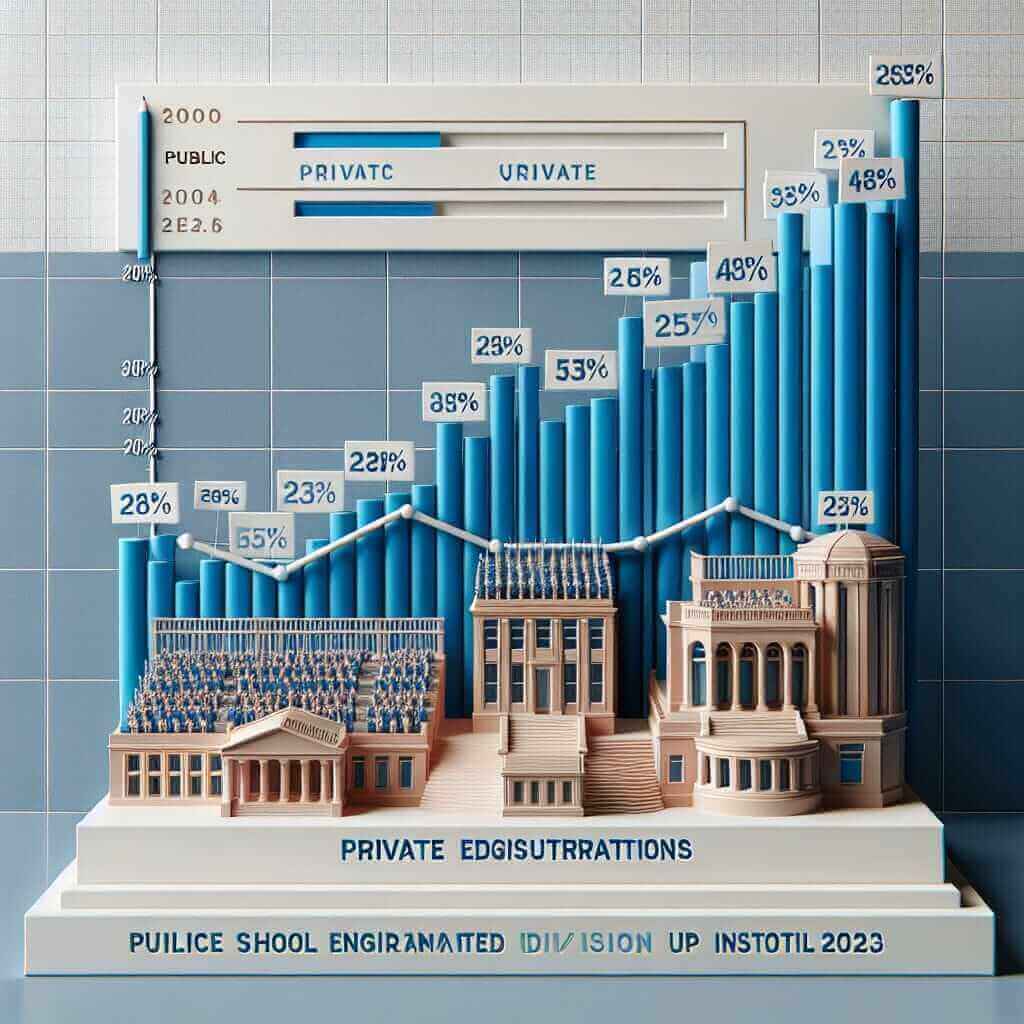
Below is a hypothetical chart based on the task:

Task Analysis
In this task, you are asked to describe a chart showing the enrollment rates in public and private schools over a period from 2000 to 2023. It’s essential to note trends, changes, and comparisons between public and private school enrollments. Ensure you cover key data points and make relevant comparisons.
Example Response
Introduction
The bar chart illustrates the percentage of students enrolled in public and private schools over a span of 23 years, from 2000 to 2023.
Overview
Overall, the enrollment rates in public schools have seen a gradual decline, while private school enrollments have shown an upward trend. There are significant fluctuations in certain years, particularly in the early 2010s.
Key Data Points and Trends
Public Schools:
- In 2000, the enrollment rate was at its peak with 75%.
- A slight decrease was observed from 2000 to 2005, dropping to 70%.
- There was a more pronounced decline between 2005 and 2013, reaching around 60%.
- Post-2013, the rate stabilized somewhat but continued to decrease, hitting 50% by 2023.
Private Schools:
- The enrollment rate started at 25% in 2000.
- An incremental rise was noticed up till 2005, increasing to 30%.
- Between 2005 and 2013, there was a steady increase, peaking at 40%.
- The rate continued to climb modestly and reached 50% by 2023, matching public school enrollment rates.
Comparisons
- In 2000, public school enrollments were three times higher than private enrollments.
- By 2023, both enrollment rates converged at 50%, showing a dramatic shift.
- The period from 2005 to 2013 was crucial, showcasing contrasting trends.
Lexical and Grammatical Notes
Vocabulary Highlights:
- Enrollment (noun) – [ɪnˈrəʊlmənt] – the number of people enrolled in a school.
- Peak (noun, verb) – [piːk] – the highest point or level reached.
- Decline (noun, verb) – [dɪˈklaɪn] – a gradual decrease.
- Fluctuation (noun) – [ˌflʌk.tʃuˈeɪ.ʃən] – an irregular rising and falling in number or amount.
- Converge (verb) – [kənˈvɜːdʒ] – come together from different directions to meet.
Grammar and Structure Tips:
- Use the past simple tense for events that occurred in a specific time frame (e.g., “The enrollment rate was at its peak in 2000”).
- Use comparative structures to highlight differences (e.g., “public school enrollments were three times higher than private enrollments”).
- Employ transition words for clarity and smooth flow (e.g., “Overall,” “In contrast,” “By 2023”).
Conclusion
In conclusion, the key to excelling in an IELTS Writing Task 1 involving a comparison of public and private school enrollment rates is to clearly outline major trends and data points, contrasting the different educational sectors effectively. By employing a mix of sophisticated vocabulary and accurate grammatical structures, you can convey the nuances of the data and achieve a Band 7+.
Remember, practice is crucial, so attempt similar tasks often to hone your skills. Good luck!