The phrase “Renewable Energy Policy Impacts (2000-2023)” represents a topic frequently appearing in IELTS Writing Task 1, requiring test-takers to analyze and summarize visual data, often presented as line graphs, bar charts, or tables. Understanding this area is crucial for achieving a high band score. This article provides a comprehensive guide to effectively tackle such tasks, focusing on vocabulary, grammar, and essential tips.
Understanding the Task
Before delving into the specifics, let’s establish a clear understanding of what IELTS Writing Task 1 entails, particularly concerning “Renewable Energy Policy Impacts.” You might encounter questions like:
- “The graph below shows the percentage of electricity generated from renewable sources in a particular country between 2000 and 2023. Summarize the information by selecting and reporting the main features and making comparisons where relevant.”
- “The table illustrates the impact of government policies on renewable energy investment in various sectors from 2000 to 2023. Write a report for a university lecturer describing the information shown.”
- “The chart compares the production and consumption of renewable energy in two different countries over a period of 23 years (2000-2023). Summarize the information by selecting and reporting the main features and make comparisons where relevant.”
Sample Task and Data Interpretation
Let’s focus on the first question and create a hypothetical line graph to illustrate the data:
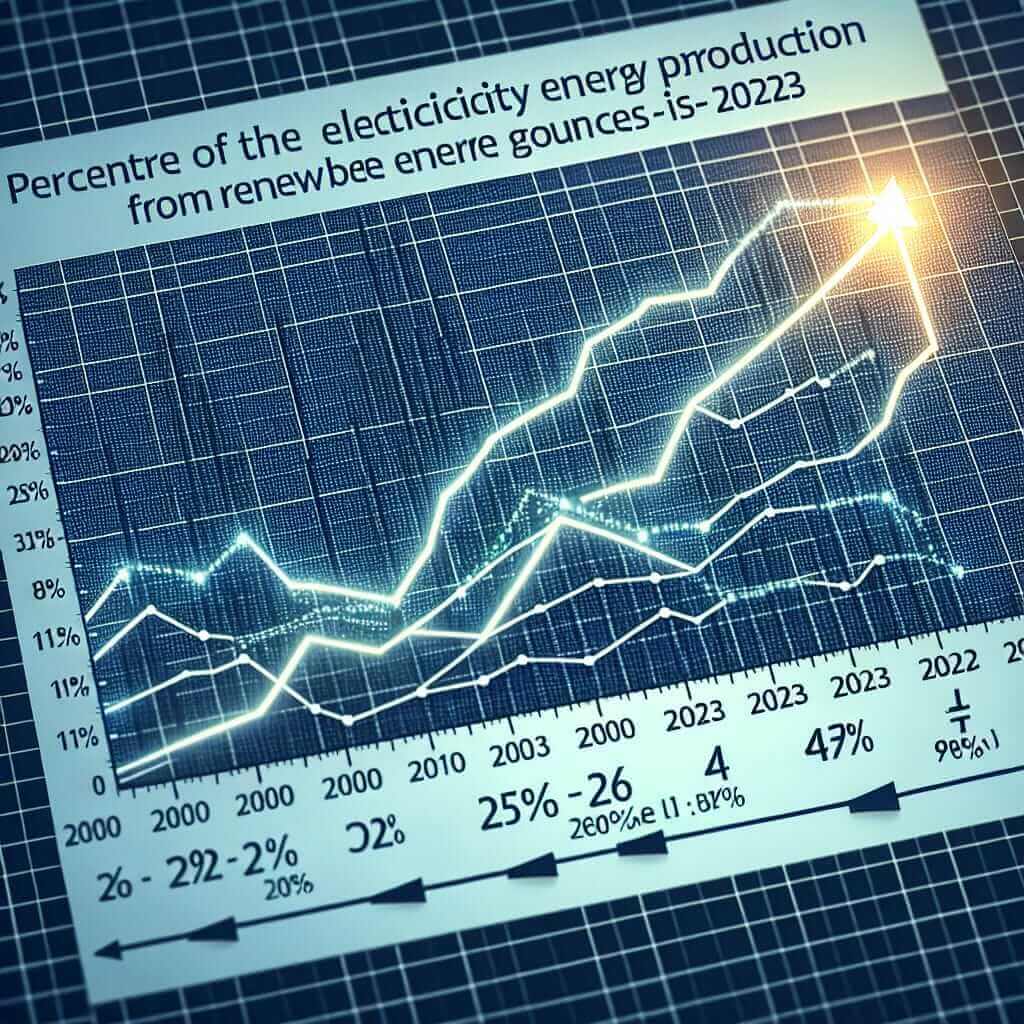
[Insert a line graph here with the following data points. Ensure the graph is appropriately labeled with “Year” on the x-axis, “Percentage of electricity generated (%)” on the y-axis, and a title like “Percentage of Electricity Generated from Renewable Sources (2000-2023).”]

- 2000: 10%
- 2005: 15%
- 2010: 20%
- 2015: 25%
- 2020: 35%
- 2023: 45%
Analysis: The graph depicts a steady upward trend in the percentage of electricity generated from renewable sources in this particular country. Starting at 10% in 2000, the figure gradually increased to 45% by 2023, demonstrating significant growth in renewable energy adoption.
Writing the Response
Introduction:
The line graph illustrates the percentage of electricity generated from renewable sources in a particular country over a 23-year period, from 2000 to 2023.
Overview:
Overall, the graph reveals a consistent upward trend in the adoption of renewable energy sources for electricity generation in the country.
Body Paragraph 1:
At the beginning of the period, in 2000, renewable energy accounted for a relatively small proportion of the total electricity generated, at only 10%. Over the next decade, this figure gradually increased, reaching 20% by 2010. This growth suggests a growing awareness and implementation of renewable energy policies during this time.
Body Paragraph 2:
The period from 2010 to 2023 witnessed a more substantial increase in the percentage of electricity generated from renewable sources. By 2015, the figure had climbed to 25%, and by 2020, it had surged to 35%. This significant jump indicates a potential intensification of renewable energy policies and investments. The trend continued, with renewable energy reaching 45% of the total electricity generation by 2023.
Conclusion:
In conclusion, the graph clearly demonstrates the positive impact of renewable energy policies implemented in this country. The consistent upward trend suggests a successful transition towards a more sustainable energy mix. (Word count: 180 words)
Key Considerations for IELTS Writing Task 1
- Accuracy: Ensure your data interpretation is precise and aligns with the visual information provided.
- Clarity: Use clear and concise language to convey the key trends and comparisons. Avoid using overly complex sentence structures.
- Vocabulary: Utilize a range of vocabulary related to trends (increase, decrease, fluctuate, peak, plateau), proportions (percentage, proportion, fraction), and comparisons (whereas, in contrast, similarly).
- Grammar: Pay close attention to grammar accuracy, particularly subject-verb agreement, tense consistency (usually past tense for describing past trends), and the use of articles.
Essential Vocabulary
- Surge (v.): /sɜːrdʒ/ – to increase suddenly and powerfully.
- Plateau (n.): /ˈplæt.oʊ/ – a period of little or no change following a period of progress or activity.
- Fluctuate (v.): /ˈflʌk.tʃu.eɪt/ – to rise and fall irregularly in number or amount.
- Proportion (n.): /prəˈpɔː.ʃən/ – a part, share, or number considered in comparative relation to a whole.
- Implementation (n.): /ˌɪm.plə.menˈteɪ.ʃən/ – the process of putting a decision or plan into effect.
Conclusion
Mastering IELTS Writing Task 1 requires a strong understanding of data interpretation, vocabulary, and grammar. By analyzing the data carefully, using precise language, and following a clear structure, you can effectively summarize visual information and achieve a high band score. Remember to practice regularly, analyze sample answers, and seek feedback to improve your writing skills.