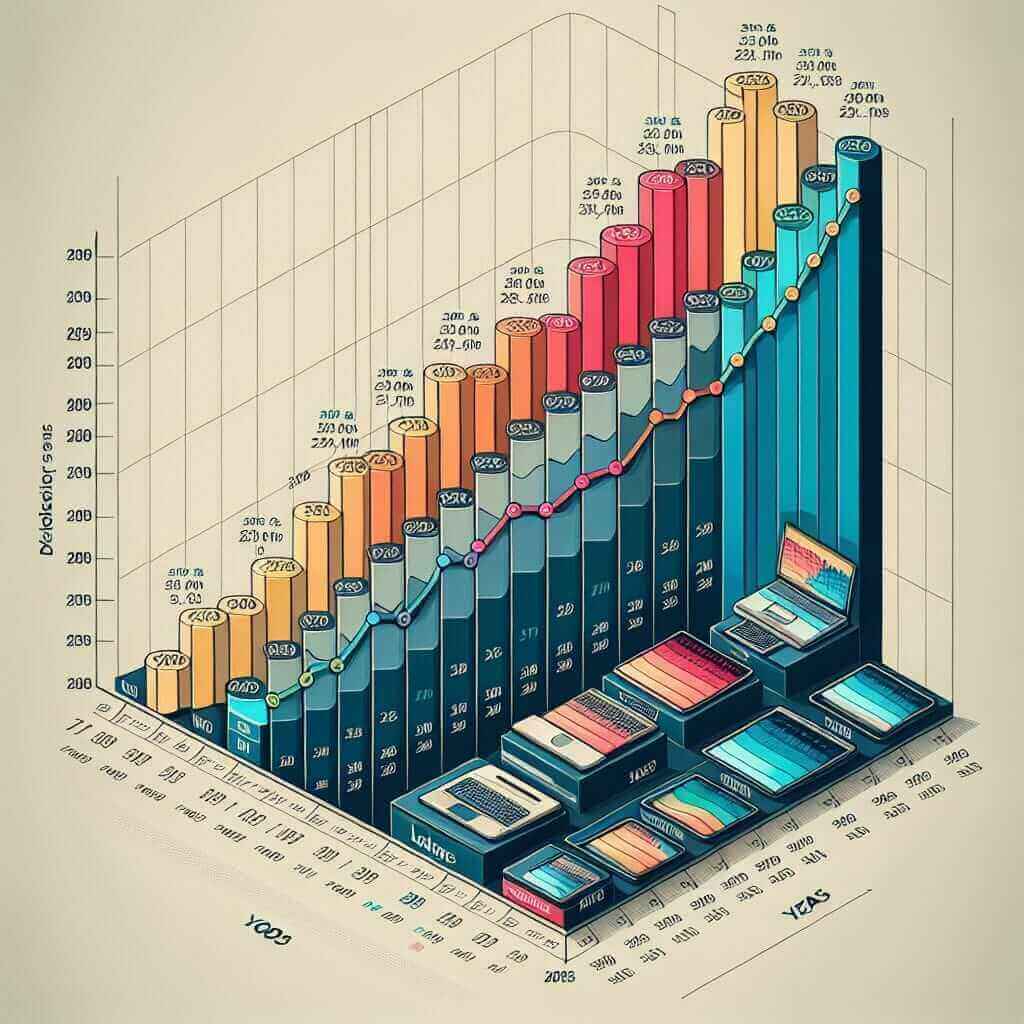
Understanding how to write an effective Task 1 essay in the IELTS Writing test is crucial for achieving a high band score. One of the common topics that appear in Task 1 is describing trends in sales data over a period of time. In this guide, we will focus on ‘Sales of Different Types of Computers from 2000 to 2023’. This is a pervasive topic and has appeared multiple times in various forms in the IELTS examination. We’ll examine key phrases, delve into the data, and provide you with a model answer.
Possible Task 1 Prompts:
- The bar chart below illustrates the sales of desktop computers, laptops, and tablets from 2000 to 2023. Summarize the information by selecting and reporting the main features and make comparisons where relevant.
- The line graph shows the number of desktop computers, laptops, and tablets sold from 2000 to 2023. Summarize the information by selecting and reporting the main features and make comparisons where relevant.
- The table provides information on the sales of different types of computers (desktops, laptops, and tablets) from 2000 to 2023. Summarize the information by selecting and reporting the main features and make comparisons where relevant.
Choosing a Prompt
Let’s choose the first prompt for a detailed analysis:
“The bar chart below illustrates the sales of desktop computers, laptops, and tablets from 2000 to 2023. Summarize the information by selecting and reporting the main features and make comparisons where relevant.”
Data Representation
To simulate a realistic IELTS Task 1, here is an example bar chart based on fictional data:

| Year | Desktop Computers (millions) | Laptops (millions) | Tablets (millions) |
|---|---|---|---|
| 2000 | 150 | 100 | 0 |
| 2005 | 160 | 120 | 20 |
| 2010 | 140 | 150 | 60 |
| 2015 | 130 | 170 | 80 |
| 2020 | 110 | 200 | 150 |
| 2023 | 90 | 230 | 200 |
Analyzing the Prompt
To perform well in Task 1, you need to:
- Introduce the chart.
- Summarize the main features.
- Make comparisons where relevant.
Model Answer
The bar chart provides information on the sales figures of desktop computers, laptops, and tablets over a period from 2000 to 2023. Overall, while desktop computer sales have experienced a gradual decline, the sales of laptops have shown a consistent upward trend, and tablet sales have surged significantly starting from 2005.
In 2000, desktop computers were the most popular, accounting for 150 million units sold. Laptops followed with 100 million units, and tablets were nonexistent in the market. By 2005, there was a slight increase in desktop sales to 160 million, while laptop sales rose to 120 million, and tablets had started to penetrate the market with 20 million units sold.
A notable change occurred in 2010 when the sales of laptops surpassed desktops for the first time, reaching 150 million compared to 140 million for desktops. During the same period, tablets saw a substantial increase, with 60 million units sold.
The trend of declining desktop sales continued over the years, falling to 130 million in 2015 and further dropping to 110 million in 2020, down to 90 million in 2023. Conversely, laptops maintained their growth trajectory, peaking at 230 million in 2023. Tablets witnessed the most dramatic growth, especially from 2010 onwards, hitting 80 million in 2015, 150 million in 2020, and finally 200 million in 2023.
In conclusion, while desktops have consistently lost popularity, both laptops and tablets have seen significant increases in sales, with tablets experiencing the most considerable growth.
(Word count: 252)
Tips for Writing
Vocabulary and Grammar:
- Use comparative and superlative forms to highlight trends (e.g., “higher than,” “the most significant growth”).
- Utilize time phrases effectively (e.g., “By 2005,” “From 2010 onwards”).
- Employ passive structures where appropriate (e.g., “A notable change occurred”).
Key Vocabulary:
- Surge (v.): to rise suddenly and powerfully (sɜːrdʒ)
- Decline (v./n.): to decrease; decrease (dɪˈklaɪn)
- Notable (adj.): worthy of attention (ˈnoʊtəbl)
- Trajectory (n.): the path followed by a trend (trəˈdʒɛktəri)
- Penetrate (v.): to successfully enter a market (ˈpɛnəˌtreɪt)
Conclusion
To excel in IELTS Writing Task 1, it’s essential to effectively summarize and compare key data points. Focus on critical trends such as increases, decreases, and notable changes. Use precise vocabulary and maintain a formal tone. By following these strategies, you can aim for a Band 7+ in your IELTS writing exam.