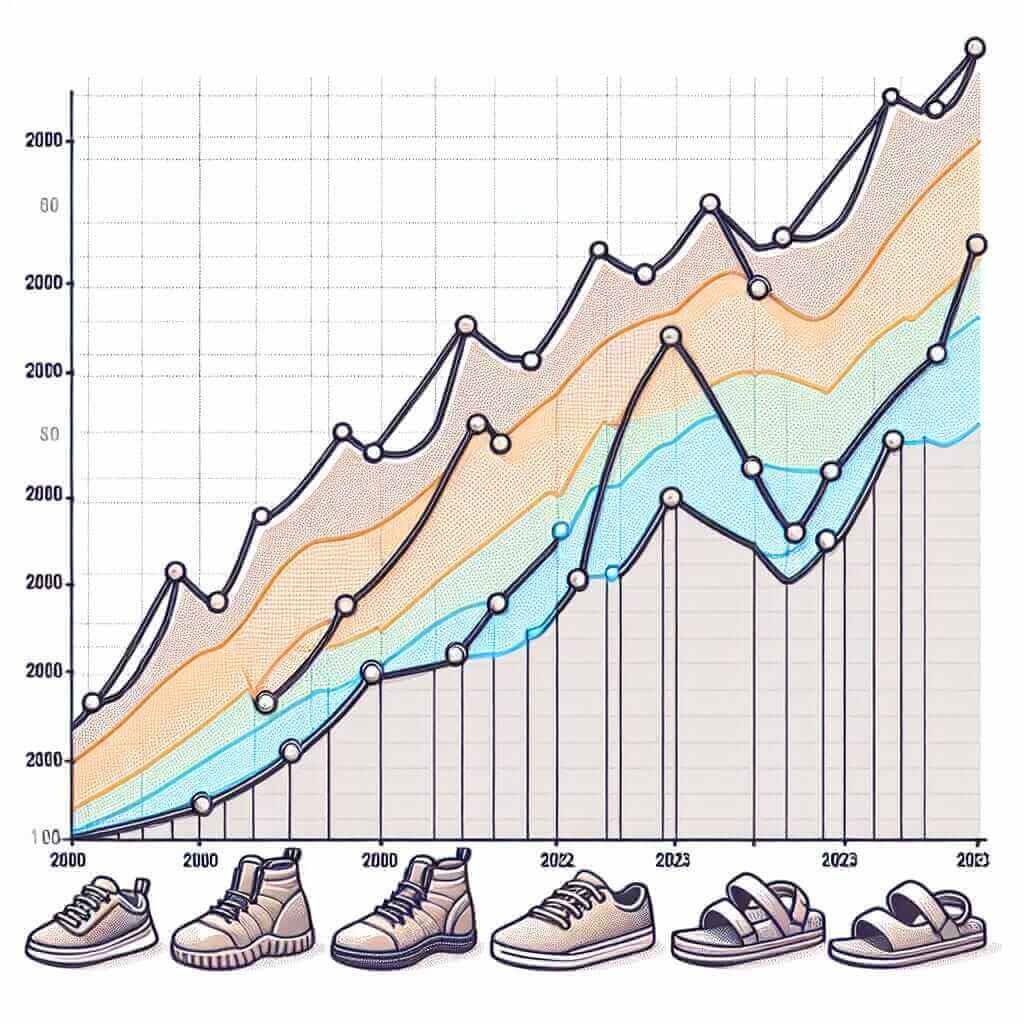
The sales of various types of footwear over the years is a topic that has frequently appeared in IELTS Writing Task 1. Understanding this topic not only helps in task 1 but also broadens vocabulary and comprehension skills in interpreting graphs and charts.
Overview of Writing Task 1
In IELTS Writing Task 1, one is required to describe and summarize visual data such as line graphs, bar charts, pie charts, or tables. The key to achieving a high band score is to identify the main trends, compare data effectively, and use a wide range of vocabulary and appropriate grammatical structures.
Example Task: Sales of Footwear from 2000 to 2023
Task Prompt
You should spend about 20 minutes on this task.
The graph below shows the sales of different types of footwear from 2000 to 2023.

Summarize the information by selecting and reporting the main features, and make comparisons where relevant.
Write at least 150 words.
Data Analysis
From the given chart, we can observe the sales trends of four different types of footwear: sports shoes, casual shoes, formal shoes, and sandals over the period from 2000 to 2023.
Writing the Response
Introduction
First and foremost, introduce the chart and provide a brief overview of what it depicts.
Writing Sample
The line graph illustrates the sales trends of four different types of footwear between 2000 and 2023.
Overall, sales of sports shoes and casual shoes showed an upward trend, whereas formal shoes and sandals witnessed a decline over the given period.
To begin with, sports shoes saw a significant increase in sales, starting at 20 million pairs sold in 2000 and reaching a peak of 80 million pairs in 2023. Similarly, casual shoes also experienced a steady rise from 10 million to 50 million pairs over the same period.
In contrast, formal shoes and sandals exhibited a downward trend. Formal shoes, which started off with the highest sales at 40 million pairs in 2000, dropped to 15 million pairs by 2023. Meanwhile, sandals sales fell from 30 million pairs to 10 million pairs, marking the lowest number of all types by the end of the period.
In summary, while the popularity of sports and casual shoes surged over time, formal shoes and sandals became less favored among consumers.
(169 words)
Key Considerations
When writing about this data, focus on comparing the different trends and making clear, concise observations. Use a range of vocabulary to describe changes and trends, such as “rise,” “decline,” “peak,” “fall,” and “steady.”
Vocabulary and Grammar Tips
Useful Vocabulary:
- Illustrate (verb) /ˈɪləstreɪt/: to show or make clear.
- Trend (noun) /trend/: a general direction in which something is developing or changing.
- Significant (adjective) /sɪɡˈnɪfɪkənt/: sufficiently great or important to be worthy of attention.
- Upward (adjective) /ˈʌpwərd/: moving towards a higher place or position.
- Peak (noun) /piːk/: the highest point.
- Steady (adjective) /ˈstɛdi/: constant in rate, pace, or amount.
- Decline (verb) /dɪˈklaɪn/: to decrease or diminish.
- Consumer (noun) /kənˈsjuːmə/: a person who purchases goods and services for personal use.
- Favored (adjective) /ˈfeɪvəd/: preferred or recommended.
Important Grammar Structures:
-
Comparative and Superlative Forms:
- Comparative: used to compare two entities (e.g., “higher,” “more popular”).
- Superlative: used to show the highest degree (e.g., “the highest,” “the most popular”).
-
The Past Participle for Passive Voice:
- Examples include “was seen,” “were sold.”
-
Describing Trends and Data:
- Use verbs like “increase,” “decrease,” “fluctuate,” and adverbs such as “significantly,” “slightly.”
Conclusion
Understanding how to describe and interpret data plays a crucial role in achieving a high score in IELTS Writing Task 1. By focusing on key vocabulary, grammar structures, and making logical comparisons, you can provide a clear, coherent response that effectively summarizes the given data. Always ensure your observations are relevant and accurately reflect the trends depicted in the visual data to achieve a Band 7 or higher.