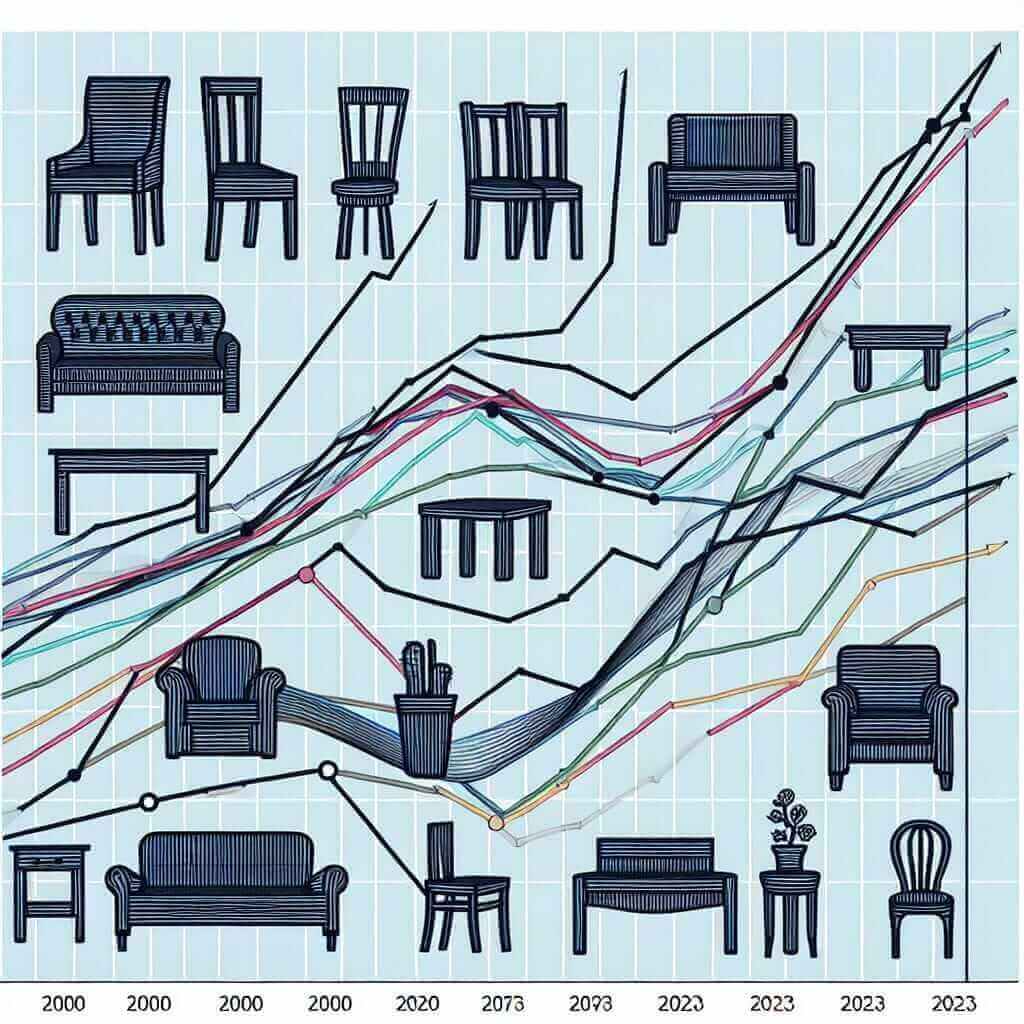
In the IELTS Writing Task 1, candidates often come across questions that require them to describe data and trends. One common topic is the sales of different types of furniture over a period of time. In this guide, we will delve into a detailed analysis of such a topic, offering tips on how to tackle it effectively, and providing an example essay.
Understanding the Task
The IELTS Writing Task 1 often presents data in the form of bar charts, line graphs, tables, or pie charts. Your task is to summarize the information by selecting and reporting the main features and making comparisons where relevant. You should write at least 150 words.
Example Task
Below is an example task related to the sales of different types of furniture over a period of time:
The chart below shows the sales of different types of furniture (e.g., chairs, tables, and sofas) from 2000 to 2023. Summarize the information by selecting and reporting the main features, and make comparisons where relevant.

Analyzing the Task
When approaching this task, it’s important to:
- Identify the Main Trends: Look for the general direction of the sales figures over the given period.
- Compare Data: Identify key comparisons, such as which type of furniture saw the highest and lowest sales.
- Highlight Changes: Note any significant changes, such as a sudden increase or decrease.
Example Essay
Now, let’s create an example essay based on the given task.
Main Features of the Example Chart
Based on the hypothetical chart:
- Overall Trends: The sales of all types of furniture increased from 2000 to 2023.
- Type Comparison: Sofas had the highest sales throughout the period, while chairs had the lowest.
- Significant Changes: There was a notable spike in table sales around 2010.
Writing the Essay
The essay below serves as a model, written in approximately 170 words.
The chart illustrates the sales of different types of furniture, namely chairs, tables, and sofas, from 2000 to 2023.
Overall, it is evident that the sales of all three types of furniture showed an increasing trend over the period. Among them, sofas consistently had the highest sales figures, while chairs remained the least sold item.
In 2000, the sales of sofas stood at 20,000 units, which increased steadily to reach 50,000 units by 2023. Similarly, table sales showed a significant upward trend. Initially at 10,000 units in 2000, table sales experienced a sharp rise, peaking at 40,000 units around 2010 before leveling off at around 35,000 units in 2023. Meanwhile, chairs, which had the lowest sales starting at 5,000 units in 2000, saw a gradual increase, reaching 20,000 units by the end of the period.
During the entire period, sofas maintained the highest sales figures in comparison to other types of furniture, indicating a strong and consistent demand. While tables experienced substantial growth, the initial and final sales of chairs were the lowest among the three categories.
Notable Vocabulary and Grammar
-
Vocabulary:
- Illustrates (verb) /ˈɪl.ə.streɪts/: to show, explain, or make something clear.
- Steadily (adverb) /ˈsted.əl.i/: in an even and regular way.
- Upward trend (noun phrase): an increasing trend.
- Consistently (adverb) /kənˈsɪs.tənt.li/: in a way that does not change.
-
Grammar Tips:
- Comparative Statements: Use comparative forms like “higher than,” “the least,” “more significantly.”
- Tenses: The task typically uses past tense and present perfect tense to describe changes over time (“increased steadily,” “has shown”).
Key Points for Writing
- Overview: Always start with a general summary of what the chart shows.
- Clear Structure: Make distinct paragraphs for overall trends and specific details.
- Data Comparison: Make sure to compare the data effectively and highlight significant trends.
Conclusion
Mastering the task of describing sales data, such as the sales of different types of furniture, involves keen observation, effective comparison, and structured writing. By noting the trends, differences, and significant points, you can craft an essay that meets the IELTS Writing Task 1 requirements. Remember to practice with various graphs to enhance your skills and build confidence.