The topic “Sales of Different Types of Home Renovation Products (2000-2023)” is a typical example of an IELTS Writing Task 1 question. This type of question usually involves describing and comparing data presented in various forms, such as charts, graphs, or tables. Understanding how to tackle this kind of task effectively is vital for achieving a high band score. In this article, we will explore this topic in detail, provide a sample question, and guide you through writing an exemplary response.
Sample Questions
- The graph below shows the sales of different types of home renovation products from 2000 to 2023. Summarize the information by selecting and reporting the main features, and make comparisons where relevant.
- Describe the table showing the amounts spent on various renovation materials between 2000 and 2023.
For this article, we will focus on the first question type involving a graph.
Main Content
1. Selected Sample Question
Let’s consider the following sample question:
“The graph below shows the sales of different types of home renovation products from 2000 to 2023. Summarize the information by selecting and reporting the main features, and make comparisons where relevant.”
2. Data Presentation
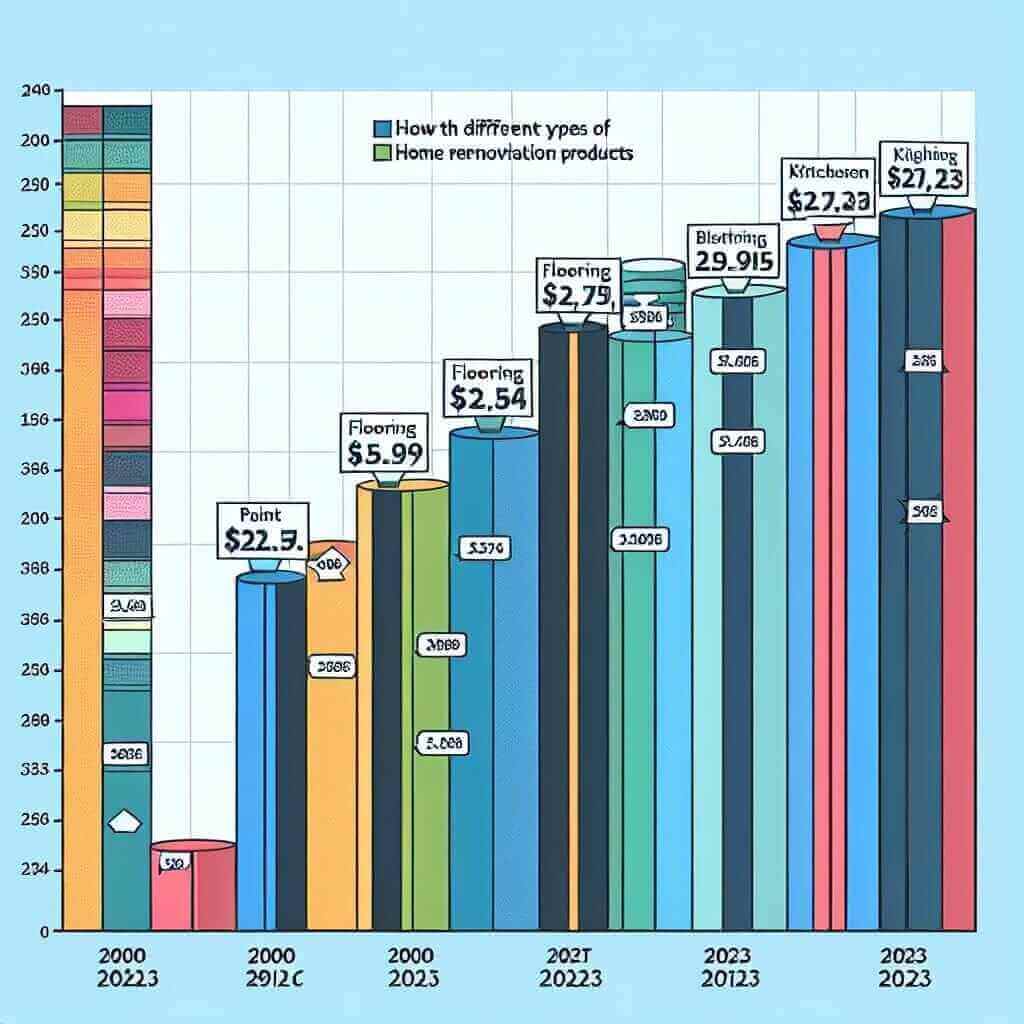
To create a detailed response, we need a visual representation of the data. Below is an example of a bar graph showing the sales of home renovation products (e.g., paint, flooring, kitchen appliances, and bathroom fixtures) over this period.
Sales of Different Types of Home Renovation Products (2000-2023)
 Home Renovation Product Sales (2000-2023)
| Year | Paint (Million $) | Flooring (Million $) | Kitchen Appliances (Million $) | Bathroom Fixtures (Million $) |
|---|---|---|---|---|
| 2000 | 500 | 300 | 400 | 250 |
| 2005 | 550 | 450 | 500 | 300 |
| 2010 | 600 | 500 | 600 | 350 |
| 2015 | 650 | 550 | 700 | 400 |
| 2020 | 700 | 600 | 800 | 450 |
| 2023 | 750 | 650 | 900 | 500 |
3. Data Analysis
Let’s analyze the data before writing our response:
- General Trend: Overall, all categories show a steady increase in sales from 2000 to 2023.
- Comparisons:
- Paint sales witnessed a consistent rise, reaching their peak in 2023 at $750 million.
- Flooring experienced significant growth, especially between 2000 and 2005, continuing to increase steadily thereafter.
- Kitchen Appliances had the most significant growth, doubling from $400 million in 2000 to $900 million in 2023.
- Bathroom Fixtures saw a relatively slower but steady increase over the years.
4. Sample Answer
Now, we put the analysis into a coherent response.
The bar graph illustrates the sales figures for four different types of home renovation products, specifically paint, flooring, kitchen appliances, and bathroom fixtures, over the period from 2000 to 2023.
Overall, there is a clear upward trend in the sales of all categories throughout the given timeframe. Among these, kitchen appliances showed the highest increase, while the growth in sales of bathroom fixtures was the least pronounced.
In 2000, the sales of paint stood at $500 million, slightly higher than those of kitchen appliances, which were $400 million. Flooring sales were $300 million, and bathroom fixtures had the lowest sales at $250 million. By 2023, the sales for paint and kitchen appliances had surged to $750 million and $900 million respectively, representing significant growth. During the same period, flooring sales rose to $650 million, and bathroom fixtures saw an increase to $500 million.
Notably, the sales of kitchen appliances experienced the most substantial growth, particularly between 2015 and 2020, where they increased by $200 million. On the other hand, bathroom fixtures, despite their steady increase, remained the lowest in terms of sales volume.
In summary, all types of home renovation products observed an upward trajectory in sales, with kitchen appliances showing the most remarkable growth, while bathroom fixtures demonstrated the slowest but steady increase.
(Word count: 223)
5. Key Points and Tips for Writing Task 1
Vocabulary and Grammar Tips:
- Comparative Structures: Use comparative adjectives (e.g., “higher,” “lower,” “more significant”) and phrases like “compared to” or “in comparison with.”
- Trend Descriptors: Terms like “increase,” “rise,” “grow,” “surge,” “decline,” “fall” are essential.
- Time Phrases: Expressions like “over the period,” “throughout the years,” “from 2000 to 2023” are useful for describing time frames.
Vocabulary to Remember:
- Illustrate (verb) /ɪˈlʌs.treɪt/: To explain or make something clear.
- Significant (adj) /sɪɡˈnɪf.ɪ.kənt/: Important or noticeable.
- Substantial (adj) /səbˈstæn.ʃəl/: Large in size, value, or importance.
- Pronounced (adj) /prəˈnaʊnst/: Very noticeable or marked.
- Trajectory (noun) /trəˈdʒek.tər.i/: The path or progression.
Conclusion
For an IELTS Writing Task 1 question involving “Sales of Different Types of Home Renovation Products (2000-2023),” focus on capturing the key trends and making relevant comparisons. Employing a variety of vocabulary and grammatical structures will help convey your analysis more effectively, aiming for Band 7 and above. Always remember to present data logically and cohesively.


