The International English Language Testing System (IELTS) exam often includes tasks that require candidates to describe and analyze trends over a period of time. One recurring topic is the analysis of sales of various types of goods, such as sports equipment. This topic has practical relevance and is an excellent way to display your analytical writing skills.
In this guide, we’ll delve into an example related to the sales of different types of sports equipment from 2000 to 2023, providing you with a sample response modeled after actual IELTS exam tasks, vocabulary tips, and grammar pointers to help you excel.
Understanding the Task
Sample Questions:
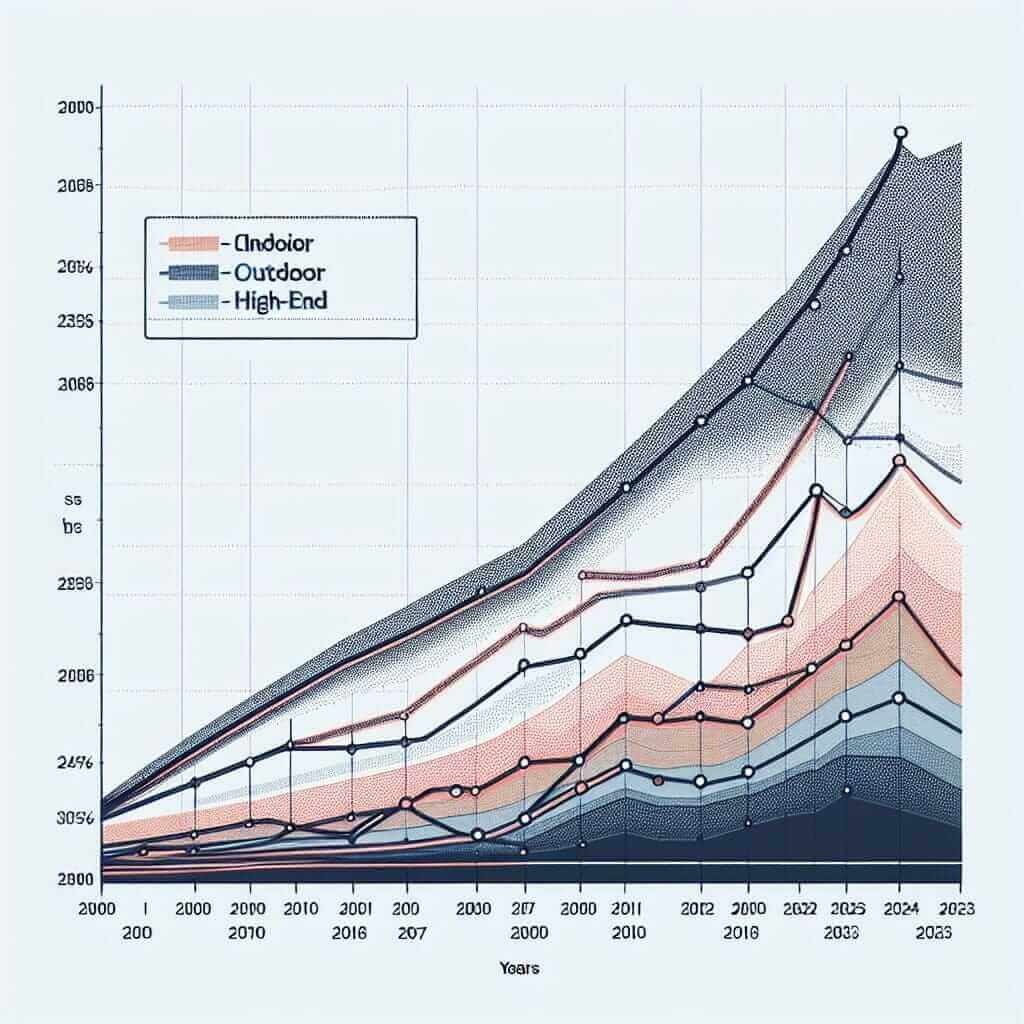
- The line graph below shows the sales of different types of sports equipment from 2000 to 2023. Summarize the information by selecting and reporting the main features and make comparisons where relevant.
- The bar chart below illustrates changes in sales figures for various kinds of sports equipment over a period of 23 years. Summarize the information by describing the trends and identifying any significant patterns.
- The table below highlights the sales data of different sports equipment types between 2000 and 2023. Summarize the information by selecting key points and comparing the changes.
Step-by-Step Guide to Writing Task 1
Choosing a Sample Task
For this guide, we will focus on the following task:
“The line graph below shows the sales of different types of sports equipment from 2000 to 2023. Summarize the information by selecting and reporting the main features and make comparisons where relevant.”
Creating the Data
Note: For the purpose of this guide, we’ll assume specific trends and figures for each type of sports equipment.

Analyzing the Task
The aim here is to describe and compare the trends shown in the graph. In your writing, you should:
- Identify the key trends.
- Compare these trends.
- Highlight any significant changes.
Writing the Sample Response
Step-by-Step Writing
Introduction
Paraphrase the task statement to introduce the topic:
“The line graph presents a comparative analysis of the sales figures for various types of sports equipment over the timeframe from 2000 to 2023.”
Overview
Summarize the key trends and highlight the main features without going into too much detail:
“Overall, the graph illustrates that while some categories of sports equipment experienced a growth in sales, others saw a decline over the specified period. Notably, sales of indoor sports equipment showed a marked increase, whereas outdoor equipment witnessed fluctuations and an eventual downturn.”
Body Paragraph 1
Describe the first set of trends and provide exact data:
“From 2000 to 2010, sales of indoor sports equipment exhibited a steady rise, starting at 20,000 units and reaching 45,000 units—a more than twofold increase. Conversely, sales of outdoor equipment experienced volatility; beginning at 30,000 units, peaking at 55,000 units in 2005, and then sharply declining to 25,000 units by 2010.”
Body Paragraph 2
Elaborate on the second set of trends for the following years:
“In the period between 2011 and 2023, indoor equipment sales continued to soar, ultimately hitting a peak of 70,000 units. Meanwhile, outdoor equipment sales declined steeply after a brief recovery in 2011, plunging to 15,000 units by 2023. Additionally, high-end sports equipment, which started with modest sales figures around 10,000 units in 2000, also saw a rise, reaching 35,000 units in 2023.”
Conclusion
Emphasize the main points and compare the overall trends:
“In summary, while indoor sports equipment demonstrated consistent growth and became the most popular category towards the end of the period, outdoor equipment sales fell dramatically with notable fluctuations. High-end sports equipment gained popularity but remained less prevalent compared to indoor equipment.”
Word Count: 232
Key Vocabulary and Grammar Points
- Tense Usage: Always use the correct tense to describe past trends (e.g., “experienced,” “rose,” “declined”).
- Comparative Structures: Use comparative adjectives and phrases (e.g., “more than twofold increase,” “less prevalent”).
- Linking Words: Connect ideas clearly using linking words (e.g., “Conversely,” “Notably,” “Ultimately”).
Essential Vocabulary
- Fluctuation (noun) /ˌflʌk.tʃuˈeɪ.ʃən/ – A change, especially a continuous and irregular one.
- Steady (adjective) /ˈsted.i/ – Gradual and continuous.
- Peak (verb/noun) /piːk/ – To reach the highest point.
- Volatility (noun) /ˌvɒl.əˈtɪl.ɪ.ti/ – Liable to change rapidly and unpredictably.
- Soar (verb) /sɔːr/ – To increase rapidly.
- Downturn (noun) /ˈdaʊn.tɜːrn/ – A decline in economic, business, or other activity.
Conclusion
When tackling IELTS Writing Task 1, especially those involving sales data, it’s essential to clearly identify and compare trends, use appropriate vocabulary, and ensure coherence throughout your response. Practice regularly with different datasets to hone your skills and aim for a Band 7 or higher.