For many IELTS candidates, describing visual information such as graphs, tables, and charts poses a significant challenge, particularly in Task 1 of the IELTS Writing test. One common topic involves the sales of different types of vehicles over a period. Understanding this type of data not only helps in exam preparation but also boosts overall comprehension and analytic skills.
Common IELTS Writing Task 1 Prompts
- Describe the changes: “The graph below shows the sales of different types of vehicles from 2000 to 2023. Summarize the information by selecting and reporting the main features and make comparisons where relevant.”
- Compare data: “The table below provides information about vehicle sales across various categories between 2000 and 2023. Write a report for a university lecturer describing the information shown.”
- Analyze trends: “The chart below illustrates the trends in vehicle sales from 2000 to 2023. Summarize the information and make comparisons where relevant.”
Choosing a Prompt
Let’s select the first prompt for our detailed analysis and writing exercise:
“The graph below shows the sales of different types of vehicles from 2000 to 2023. Summarize the information by selecting and reporting the main features and make comparisons where relevant.”
Finding Data and Creating a Chart
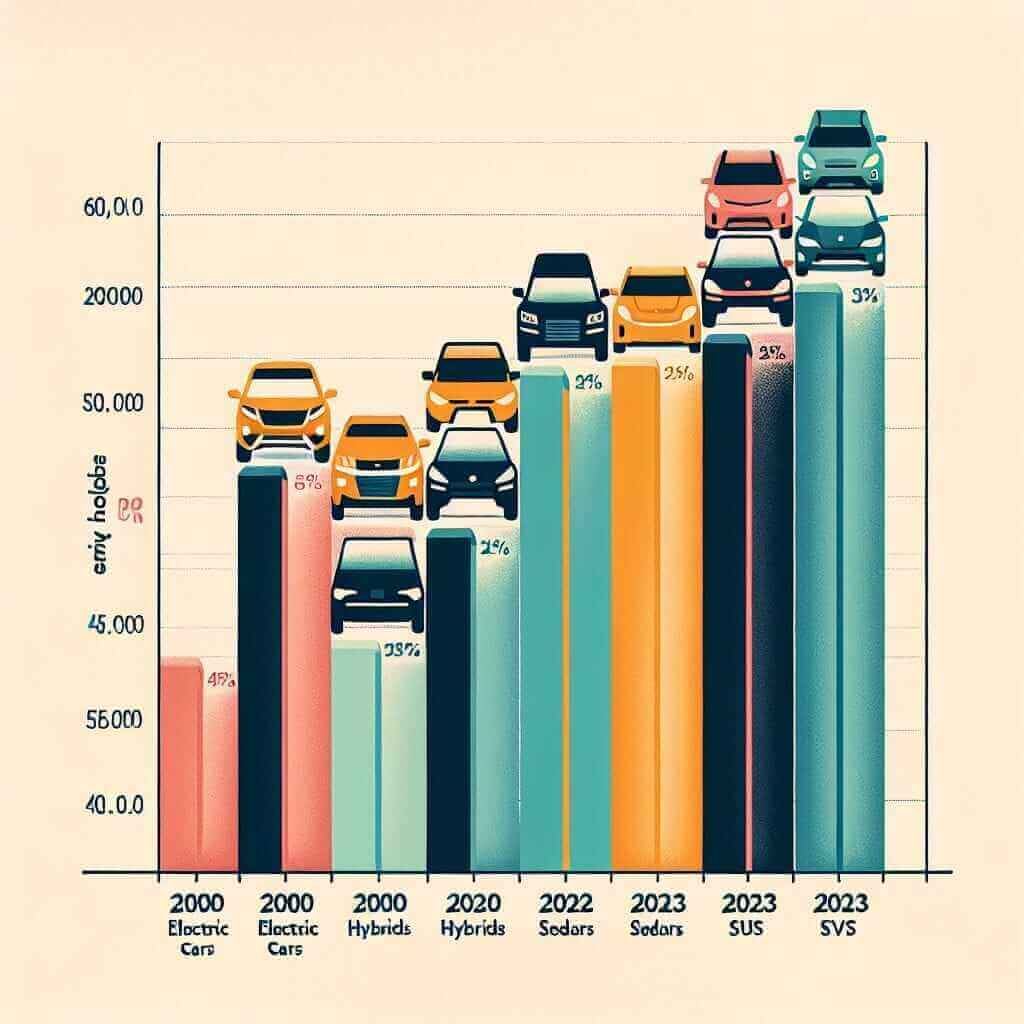
Example Chart: Sales of Different Types of Vehicles (2000-2023)
To simulate a real IELTS Writing Task 1 experience, we have created a sample bar chart.

Note: Please imagine or create a suitable chart based on the prompt to replace the example link above.
Analyzing the Prompt
Before writing, it is crucial to understand what the task requires. Here, you are expected to:
- Summarize main features of the sales data.
- Compare different vehicle types where relevant.
- Highlight notable trends and changes over the given period.
Writing the Sample Response
Introduction
In the initial paragraph, rephrase the task prompt and provide a general overview of the data.
Overview
The second paragraph should summarize the most striking features of the data, without too much detail.
Detailed Paragraphs
The following paragraphs should elaborate on specific trends, changes, and comparisons between different types of vehicles.
Sample Response
Introduction
The bar chart illustrates the sales of four types of vehicles—electric cars, hybrids, sedans, and SUVs—between 2000 and 2023. Overall, the sales patterns exhibit significant variations across different categories over the given period.
Overview
It is evident that electric car sales experienced a substantial rise, while sedan sales saw a marked decline. Meanwhile, hybrid vehicles and SUVs displayed fluctuating trends with varying sales figures.
Detailed Analysis
In 2000, sedan sales dominated the market, with approximately 1.5 million units sold. However, by 2023, this figure had drastically decreased to around 0.5 million units. Conversely, electric cars, initially with minimal sales in 2000, surged to about 1.2 million units by 2023.
Hybrid vehicles showcased an inconsistent pattern. Starting with 0.3 million units in 2000, sales peaked at 0.9 million in 2015 but fell to 0.6 million by 2023. SUVs’ popularity grew steadily, beginning at 0.5 million and increasing to 1.1 million over the same period.
Conclusion
To conclude, the bar chart reveals diverse trends in vehicle sales from 2000 to 2023. Electric and SUV sales soared, hybrid vehicle sales fluctuated, and sedan popularity sharply declined.
Word Count: 203 words
Key Vocabulary and Phrases
- Exhibit (verb) [ɪɡˈzɪbɪt]: To show or demonstrate.
- Substantial (adjective) [səbˈstænʃl]: Considerable in amount, value, or importance.
- Fluctuating (adjective) [ˈflʌktʃueɪtɪŋ]: Varying or changing irregularly.
- Surge (verb) [sɜːrdʒ]: To increase suddenly and powerfully.
- Peak (verb/noun) [piːk]: Reach the highest point.
Conclusion
When tackling an IELTS Writing Task 1 question on vehicle sales, it is important to:
- Introduce the topic clearly.
- Provide an overview highlighting general trends.
- Break down specific details with comparisons and changes.
- Use precise vocabulary to describe data.
By following this structured approach, candidates can aim for a high band score while effectively communicating their analysis.
Employ these strategies in your practice to improve and succeed in the IELTS Writing test.