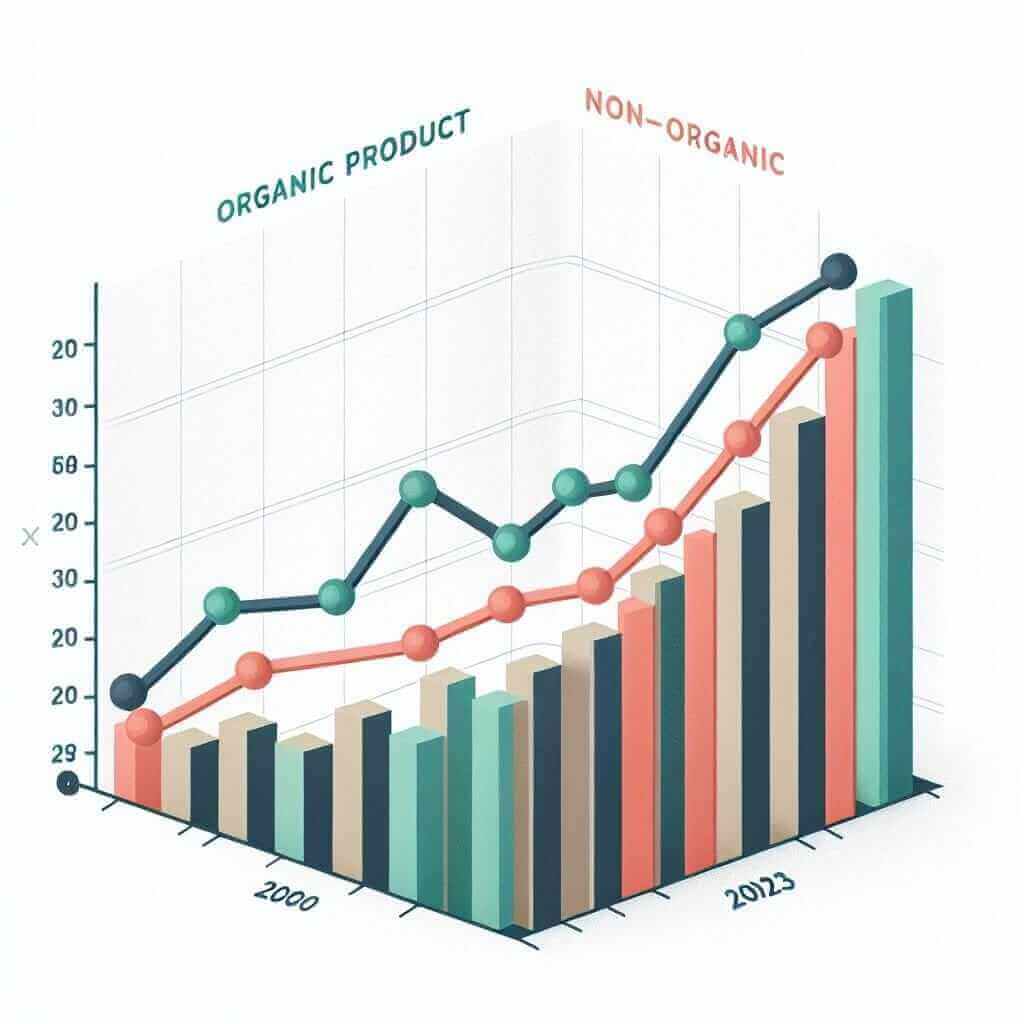
The IELTS Writing Task 1 often requires candidates to write about data and trends. This task involves interpreting graphs, charts, or diagrams and summarizing the key features. Today’s topic, “Sales of Organic vs Non-Organic Products (2000-2023)”, is a perfect example that could appear in the IELTS exam. We’ll explore this topic in depth, presenting a sample task and a model answer to help you achieve Band 7+.
Understanding the Topic
When it comes to the sales of organic and non-organic products over a period, we must pay attention to trends, comparisons, and significant changes. This kind of task tests your ability to identify and describe key features and make comparisons where relevant.
Sample Task
You should spend about 20 minutes on this task.
The graph below shows the sales of organic and non-organic products from 2000 to 2023.
Summarize the information by selecting and reporting the main features and make comparisons where relevant.
[Insert Graph or Chart Here]

Analysis of the Task
In this task, you need to:
- Identify the main trends.
- Compare the sales figures of organic and non-organic products.
- Highlight any significant changes over the specified period.
Writing the Report
Introduction
Begin with a clear and concise introduction that paraphrases the task.
Example:
The line graph illustrates the sales of organic and non-organic products between 2000 and 2023.
Overview
Provide an overall summary of what the graph demonstrates without specific details.
Example:
Overall, sales of organic products have shown a steady increase over the years, whereas sales of non-organic products have fluctuated, with a general downward trend in recent years.
Body Paragraphs
Divide the body into two paragraphs. One focusing on organic products and the other on non-organic products.
Paragraph 1: Organic Products
- Trend Analysis: Discuss the growth trend of organic products.
- Key Data Points: Mention significant years or milestones.
Example:
Sales of organic products started at $1 billion in 2000 and experienced a steady rise. By 2010, sales had tripled, reaching $3 billion. This upward trend continued, peaking at $10 billion in 2023.
Paragraph 2: Non-Organic Products
- Fluctuations: Highlight the fluctuations in sales.
- Comparative Analysis: Compare key points with organic sales.
Example:
Non-organic products, on the other hand, began at $4 billion in 2000. Although sales peaked at $6 billion in 2010, they began to decline thereafter, falling to $3 billion by 2023. This indicates a shift in consumer preference towards organic products.
Model Answer
The line graph illustrates the sales of organic and non-organic products from 2000 to 2023. Overall, sales of organic products exhibit a consistent upward trend, while non-organic product sales are more volatile and show a decline in the latter years.
Starting at $1 billion in 2000, organic product sales have increased steadily. By 2010, sales had risen to $3 billion, and by 2023, they reached a peak of $10 billion. This reflects a growing consumer interest and trust in organic products over the years.
Conversely, non-organic product sales started at $4 billion in 2000 and saw a rise to $6 billion by 2010. However, post-2010, their sales have dwindled, dropping to $3 billion in 2023. This downward trend suggests a gradual shift in consumer preference towards organic products.
In summary, the graph indicates a robust growth in organic product sales, alongside a declining trend in non-organic product sales, signaling a shift in consumer behavior towards organic options over the period.
(174 words)
Important Tips and Advice
- Structure Your Answer: Always have an introduction, an overview, and two body paragraphs.
- Use Comparisons: Make relevant comparisons to show trends and contrasts.
- Data Reference: Mention specific figures and years when needed to support your points.
Vocabulary and Expressions
- Trend: upward trend, steady increase, significant growth, decline, fluctuation.
- Comparison: whereas, while, in contrast, similarly, compared with.
- Data Description: started at, reached a peak, increased to, fell to, fluctuated.
Critical Vocabulary
- Fluctuation (noun) /ˌflʌk.tʃuˈeɪ.ʃən/: irregular rises and falls in number or amount.
- Downward Trend (noun phrase): a general decrease over a period of time.
- Milestone (noun) /ˈmaɪl.stoʊn/: an important event in the development or history of something.
- Consistent (adjective) /kənˈsɪs.tənt/: acting or done in the same way over time.
- Volatile (adjective) /ˈvɑː.lə.təl/: liable to change rapidly and unpredictably.
Conclusion
To achieve a high band score in IELTS Writing Task 1, you must analyze the data thoroughly, make clear comparisons, and use a wide range of vocabulary and grammatical structures. The practice and understanding of trends in data, as demonstrated above with the topic “Sales of Organic vs Non-Organic Products”, can significantly enhance your writing capabilities and confidence during the exam. Remember, clarity and accuracy are key!