As an IELTS instructor with over 20 years of experience, I often get asked by my students: “Should I describe the diagram in detail during IELTS Writing Task 1?”. It’s a valid question! After all, time is precious in the exam, and you want to use it wisely.
Table Of Contents
Understanding the Task
The key to answering this question lies in understanding the task itself. In IELTS Academic Writing Task 1, you are expected to summarise the information presented in a visual format, which could be a graph, chart, table, map, or diagram. The instructions will always include the phrase “summarise the information by selecting and reporting the main features and make comparisons where relevant.”
Focusing on the Key Features
Notice the emphasis on “main features” and “comparisons.” This means your primary goal is to demonstrate your ability to:
- Identify the most significant trends, patterns, or changes in the data. What stands out as the most important information?
- Compare and contrast different elements within the visual. How do the data points relate to each other?
- Present this information in a clear, concise, and well-organized manner.
The Role of Description
Describing the diagram itself, such as its axes, labels, or individual components, is generally NOT considered a “main feature.” Spending too much time on these details will eat into your word count and may not contribute significantly to your score.
When Description is Useful
There are, however, instances where a brief description can be beneficial:
- Complex Processes: If the diagram illustrates a process with multiple stages, a very concise overview of the process can provide context for your analysis.
- Unfamiliar Diagrams: If the diagram type is unusual or contains technical terms, a brief explanation can aid understanding. For example, you might need to clarify what a “flow chart” or a “venn diagram” represents.
Tips for Effective Diagram Analysis
- Analyze before you write: Spend a minute or two carefully studying the diagram. Identify the main features, trends, and any striking differences or similarities.
- Paraphrase the question: Use synonyms and different grammatical structures to rephrase the question prompt in your introduction.
- Group information logically: Organize your body paragraphs based on key trends, comparisons, or stages in a process.
- Use data to support your points: Include specific figures, percentages, or time periods to provide evidence for your observations.
- Don’t over-interpret: Stick to what the data shows. Avoid making assumptions or drawing conclusions that are not directly supported by the diagram.

Example: Comparing Two Maps
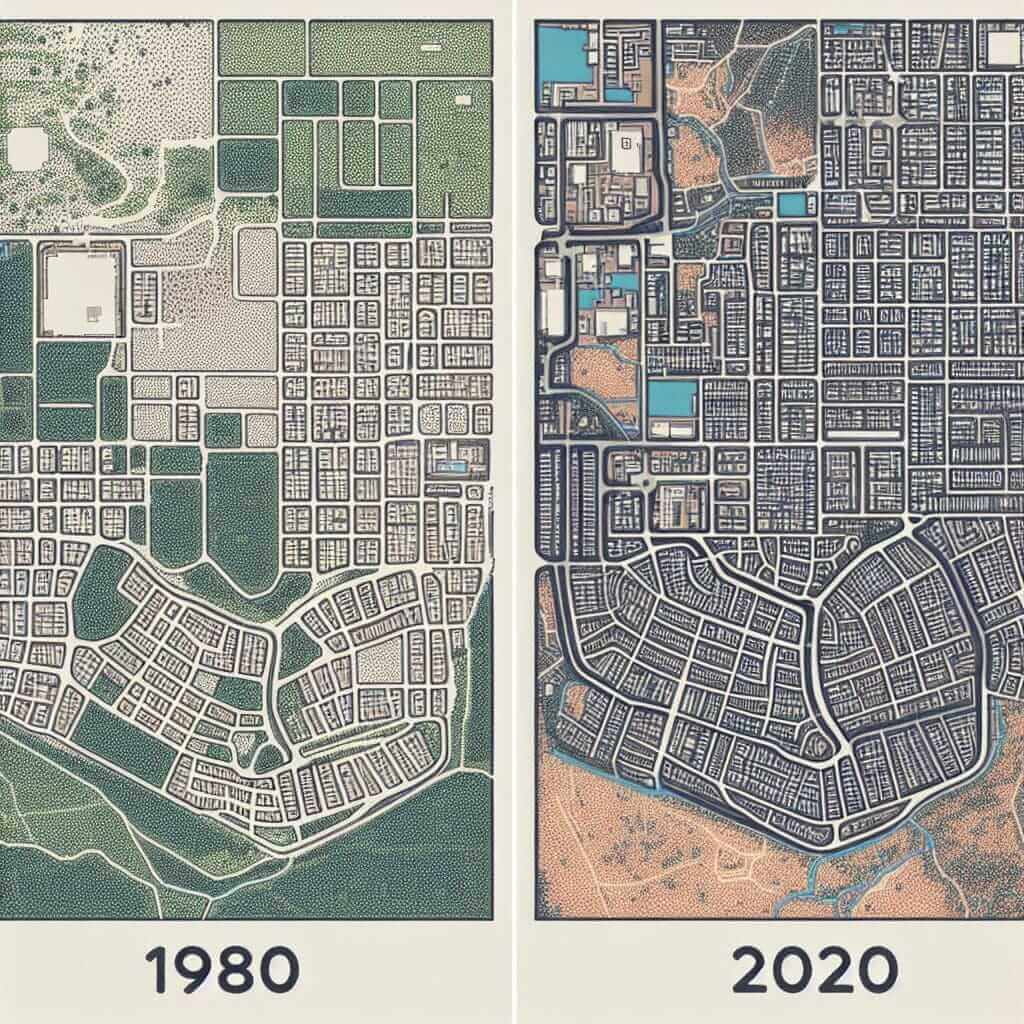
Imagine you’re presented with two maps showing the layout of a town in 1980 and 2020. Instead of describing the maps’ components (roads, buildings, etc.), focus on the significant changes:
Ineffective: “The first map shows a river running through the town. There is a factory in the north and a park in the south.”
Effective: “The town underwent significant development between 1980 and 2020. The industrial area in the north expanded considerably, while the park in the south was reduced in size to make way for residential housing.”
Conclusion
In IELTS Writing Task 1, your priority is to demonstrate your ability to analyze and interpret visual data. While a brief description might be helpful in certain situations, avoid lengthy explanations of the diagram itself. Focus on the main features, comparisons, and trends, and support your observations with specific data. By following these tips, you can write a clear, concise, and high-scoring response.