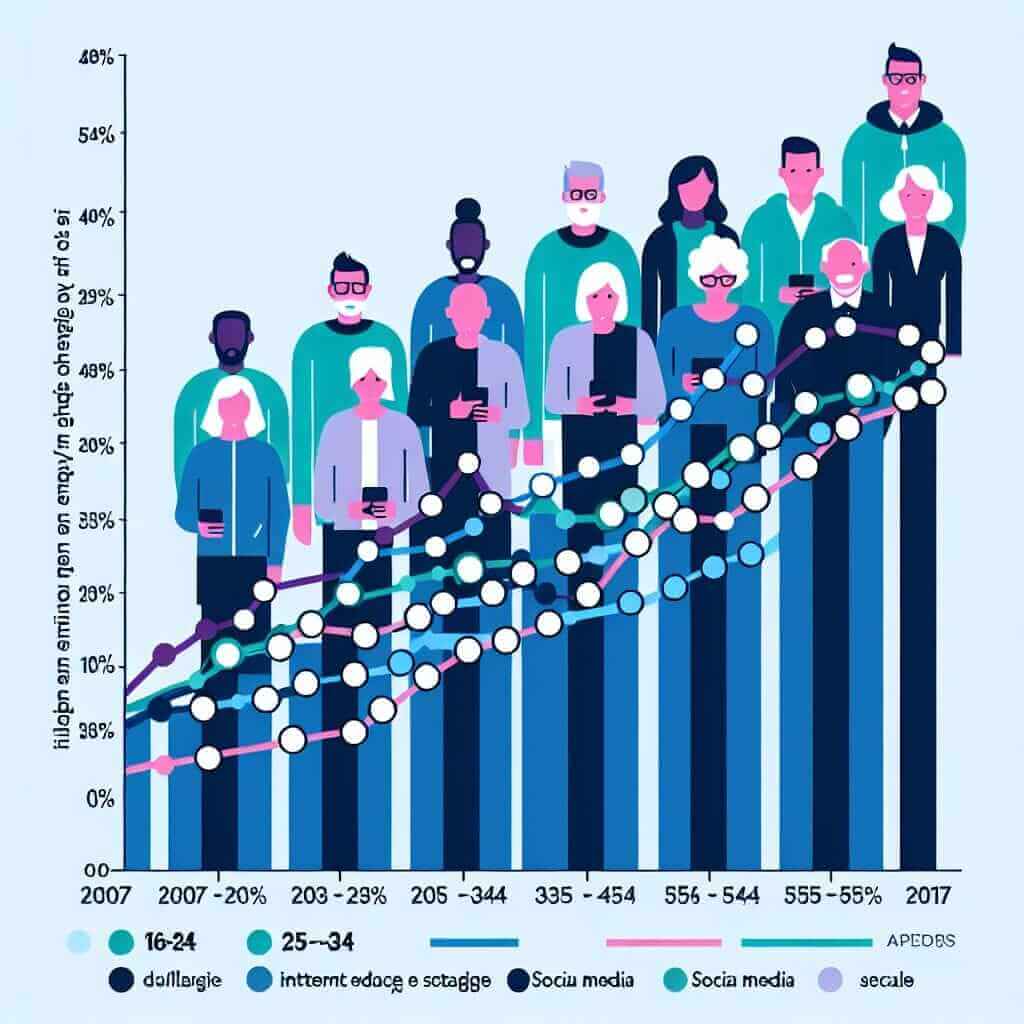
The use of social media has skyrocketed in the 21st century, making it a frequent topic in the IELTS Writing Task 1. Understanding how to interpret and write about “Social Media Usage by Demographic (2000-2023)” can significantly impact your band score. This guide will equip you with the essential tools and knowledge to tackle such tasks effectively.
Nội dung bài viết
- Potential IELTS Writing Task 1 Questions
- Sample IELTS Writing Task 1: Line Graph
- The line graph below shows the percentage of internet users aged 16-64 in the UK who used social media from 2007 to 2017.
- Summarise the information by selecting and reporting the main features, and make comparisons where relevant.
- Analysis of the Task
- Model Answer
- Key Writing Tips
- Vocabulary Focus
- Conclusion: Achieving Band 7+
Potential IELTS Writing Task 1 Questions
The versatility of this topic allows for a range of question formats, including:
- Line graph: Showing the percentage of different age groups using social media platforms over time (2000-2023).
- Bar chart: Comparing the preferred social media platforms across various demographics (age, gender, location) in a given year.
- Pie charts: Illustrating the proportion of time spent on different social media activities (messaging, browsing, posting) by a specific age group.
Sample IELTS Writing Task 1: Line Graph
Let’s dive into a practical example:
The line graph below shows the percentage of internet users aged 16-64 in the UK who used social media from 2007 to 2017.
Summarise the information by selecting and reporting the main features, and make comparisons where relevant.

Analysis of the Task
This task requires you to:
- Identify: Pinpoint the key trends and significant features displayed in the line graph.
- Report: Describe these trends and features accurately using appropriate vocabulary and grammar.
- Compare: Highlight any noticeable differences or similarities between the trends.
Model Answer
The line graph illustrates the proportion of internet users aged 16-64 in the UK who engaged with social media from 2007 to 2017.
Overall, there was a dramatic increase in the use of social media by people in this age group over the period shown. While the youngest age group consistently had the highest percentage of social media users, all age groups experienced significant growth.
In 2007, approximately 50% of 16-24 year olds used social media, compared to around 20% of 25-34 year olds and just 5% of those aged 55-64. Over the next five years, the figures for all age groups rose steadily, with the largest increase seen in the 16-24 age group, reaching nearly 90% by 2012.
From 2012 to 2017, the percentage of 16-24 year olds using social media plateaued at around 90%, while the figures for the older age groups continued to increase, albeit at a slower pace. By 2017, social media usage among 25-34 year olds had risen to 80%, while over half of 55-64 year olds were engaging with social media.
(Word count: 175 words)
Key Writing Tips
- Paraphrase: Begin by paraphrasing the question to demonstrate your vocabulary range.
- Overview: Provide a general overview of the trends before delving into specifics.
- Data Selection: Select the most significant data points to support your description.
- Comparisons: Use comparative language (e.g., higher than, lower than, while, whereas) to highlight differences and similarities.
- Tenses: Use appropriate tenses to reflect the time frame presented in the graph (past simple for past years, present perfect for trends over time).
Vocabulary Focus
- Dramatically: (adverb) suddenly and noticeably.
- Consistently: (adverb) in every case or on every occasion; invariably.
- Steadily: (adverb) in a regular and even manner.
- Plateaued: (verb) reached a state of little or no change after a period of activity or progress.
- Albeit: (conjunction) although; even if.
Conclusion: Achieving Band 7+
To excel in IELTS Writing Task 1 on “Social Media Usage by Demographic,” remember to:
- Understand the data: Carefully analyze the graph, chart, or table before writing.
- Structure your response: Follow a clear and logical structure, starting with an introduction, followed by an overview, and then detailed body paragraphs.
- Use a range of vocabulary: Showcase your vocabulary by using a variety of words and phrases to describe trends, comparisons, and changes over time.
- Grammar accuracy: Pay close attention to grammar, particularly tenses and subject-verb agreement.
- Proofread carefully: Allow time to proofread your work for any errors before submitting.
By consistently applying these strategies, you’ll be well-prepared to analyze and write about social media usage trends, boosting your confidence and paving the way for a successful IELTS Writing score.